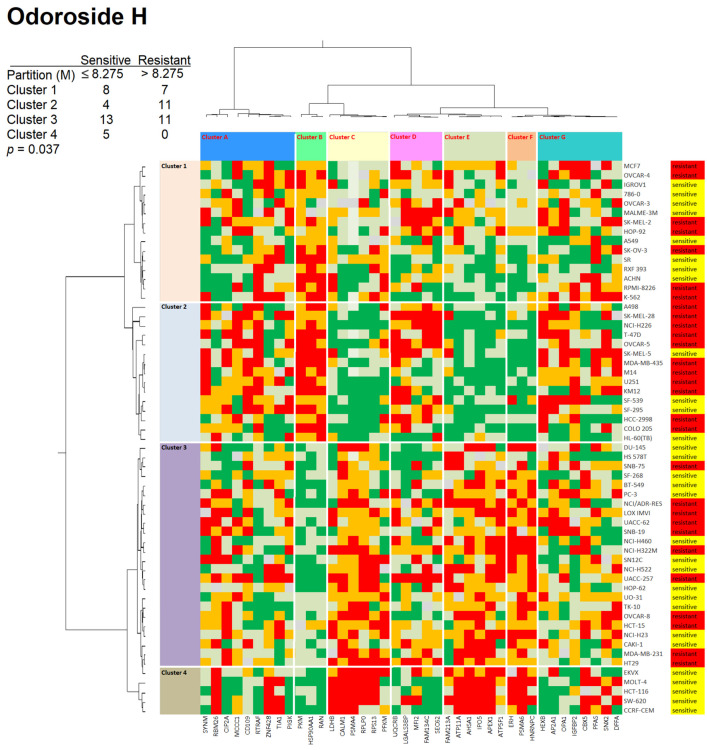
Figure 11.
Heat maps and hierarchical cluster analyses of proteins whose expression correlated with the response of 59 tumor cell lines to odoroside H (log10IC50). The proteins are given in Supplementary Table S1. The cell lines, their tumor origins, and their sensitivity/resistance to odoroside H are shown on the right side of the heat maps. Cell lines with individual log10IC50 values smaller than the median value of all 59 cell lines tested for odoroside H were defined as sensitive, while all others with log10IC50 values above the median were defined as resistant. The cell lines were clustered according to their degrees of relatedness to each other on the basis of their protein expression included in the analysis. Color code: red, 0–25% quartile; orange, 26–50% quartile; grey, median value; light green, 50–75% quartile; dark green, 76–100% quartile.

