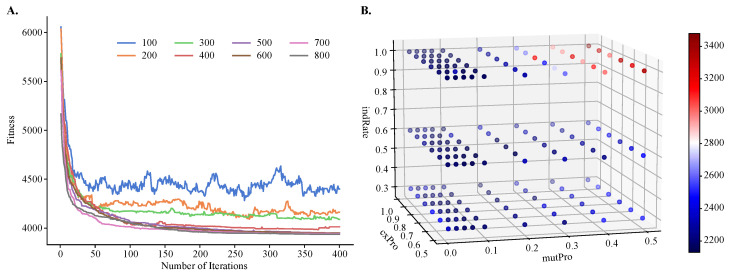
Figure 4.
Hyperparameter tuning of population size, number of iterations, individual mutation rate, mutation probability, and crossover probability for objective . Shown are (A) a line plot of fitness values obtained by varying population size and number of iterations and (B) a three-dimensional heatmap of fitness values obtained by varying mutation probability, crossover probability, and individual mutation rate. A small fitness value is preferred.

