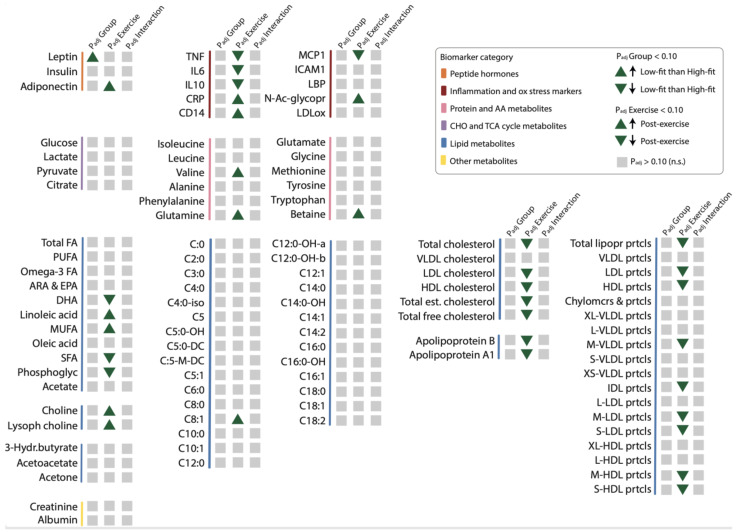
Figure 1.
The effect of fitness level and a recent exercise bout on individual biomarker and metabolic parameter levels. Graphical summary representing the fitness level effect (PadjGroup), recent exercise effect (PadjExercise), and interaction effect (PadjGroup*Exercise, shown as PadjInteraction) on individual biomarker and metabolic parameter levels within each functional biomarker and metabolic parameter category (indicated by colour). Significant fitness level effects (Padjgroup < 0.10) or recent exercise effects (Padjexercise < 0.10) are depicted by upward and downward green triangles that indicate the direction of the effect. Non-significant effects (Padjgroup, Padjexercise, or Padjgroup*exercise > 0.10) are depicted in grey squares (all interaction effects were not significant). The main effects (fitness level and recent exercise) and interaction effects were analysed using RM-ANOVA.

