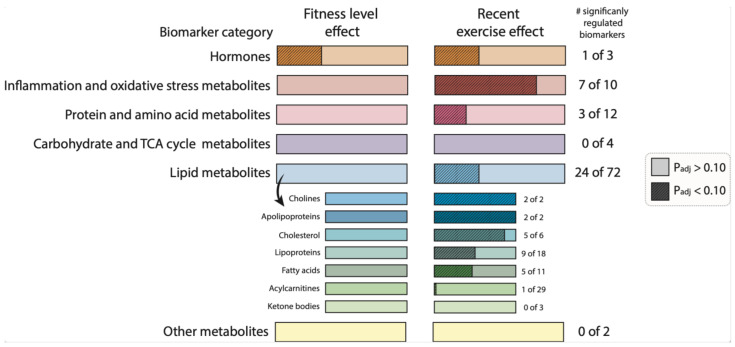
Figure 3.
The effect of fitness level and a recent exercise bout on biomarkers and metabolic parameters category responses. Graphical summary representing the number of significantly regulated biomarkers and metabolic parameters between high-fit and low-fit females (fitness level effect, and left bars) and the number of significantly regulated biomarkers and metabolic parameters between baseline and post-exercise (recent exercise effect, right bars). Non-significant effects (adj.Pgroup or adj.Pexercise > 0.10) are depicted in light-coloured bars and significant effects (adj.Pgroup or adj.Pexercise < 0.10) are depicted in dark-coloured, dashed bars. The filled area is calculated relative to the number of biomarkers and metabolic parameters within the corresponding functional category.

