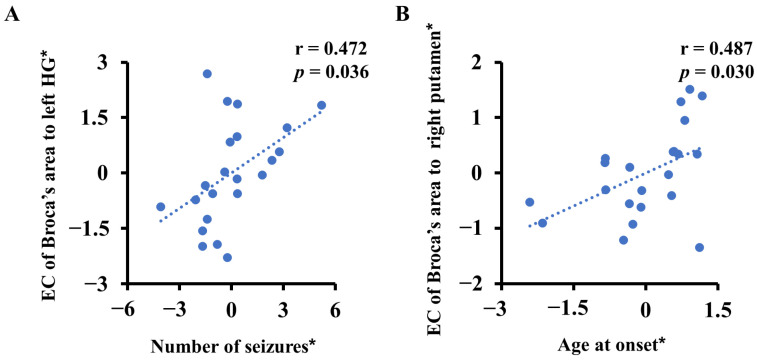
Figure 4.
Correlations between clinical features and abnormal effective connectivity (EC) in the medicated group (medicated benign epilepsy with centrotemporal spikes). Asterisks (*) indicate residuals of the linear regression model controlling for both age and sex. (A) The EC from Broca’s area to the left HG was positively related to the frequency of seizures. HG, Heschl’s gyrus. (B) The EC from Broca’s area to the right putamen was positively related to the age at onset.

