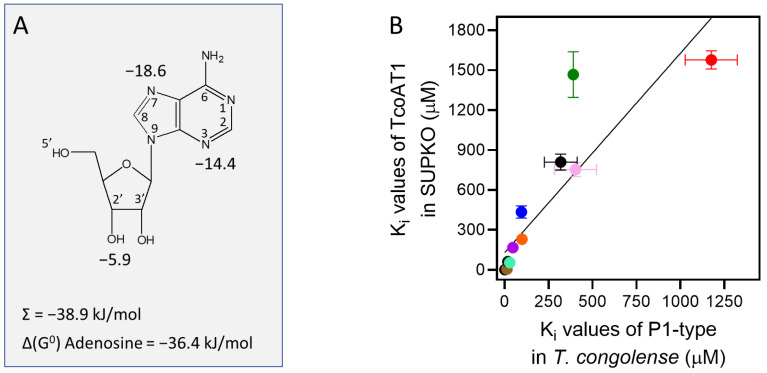
Figure 4.
Model of adenosine uptake by TcoAT1. (A) Model for the interactions between adenosine and the TcoAT1 binding pocket, showing interactions at N3, N7 and 3′-OH, with Gibbs free energy of interaction indicated in kJ/mol. The sum of these energies and the experimental value for the adenosine ΔG0 is also indicated. (B) Correlation of Ki values for nucleosides and nucleobases in T. congolense TcoAT1-type and TcoAT1 expressed in SUPKO. The Ki values obtained for each substrate revealed a similar affinity trend for TcoAT1 in the parasite and when expressed in the SUPKO surrogate (r2 = 0.78). Slope was significantly different from zero (p < 0.0001 by F-test).

