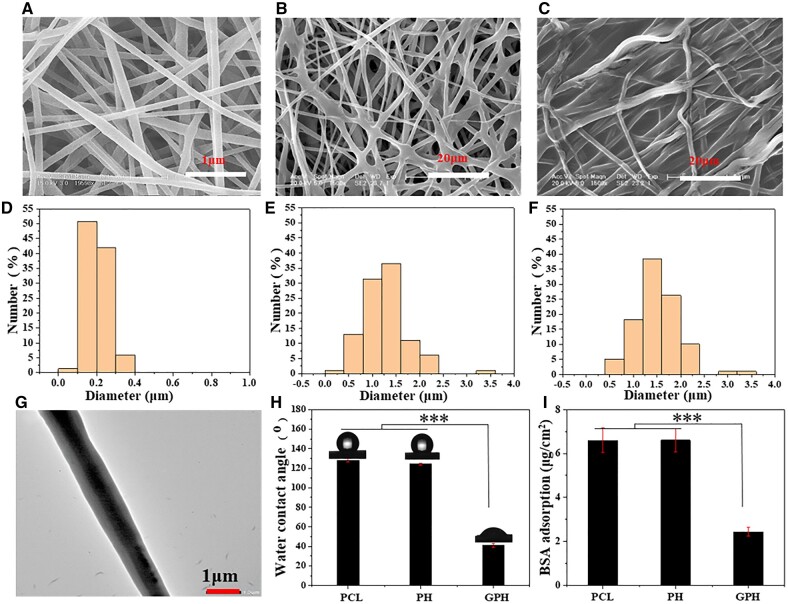
Figure 1.
Construction of multicomponent composite fiber scaffold. (A–C) SEM images of PCL, PH and GPH fiber scaffold. (D–F) Diameter distribution of PCL, PH and GPH fiber scaffold. (G) TEM image of core–shell fibers. (H) The water contact angle, of PCL, PH and GPH fiber scaffold. (I) Adsorption capacity of BSA protein. The data are shown as the means ± standard deviation from three independent experiments. ***P < 0.001 indicates significant differences between the indicated columns.

