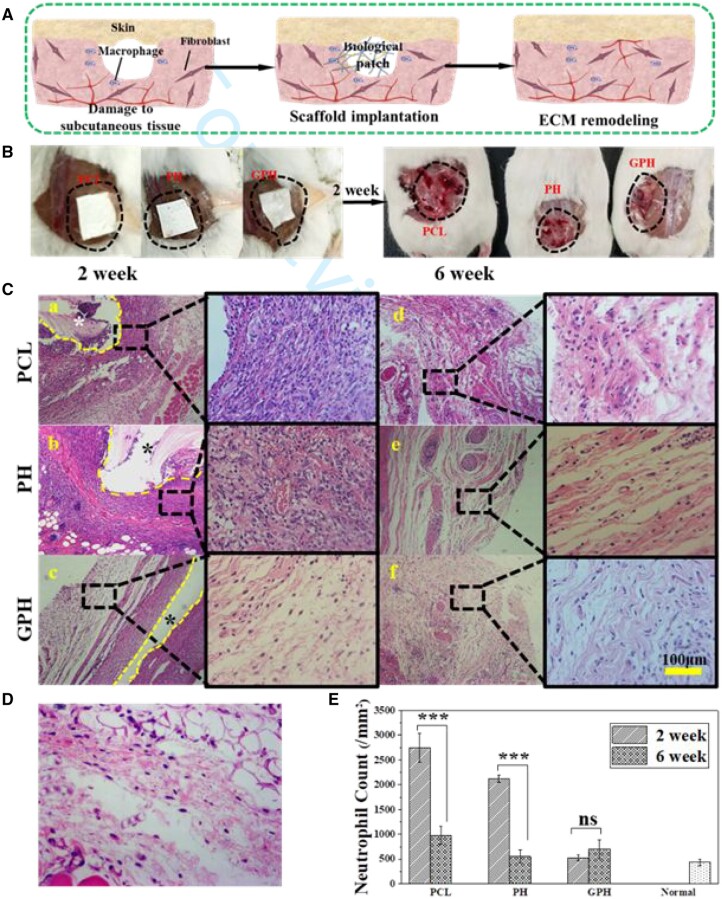
Figure 5.
GPH fiber scaffold inhibits fibrosis during tissue repair. (A) The diagram of an in vivo experiment. (B) Left is the image of the scaffold implantation into the injury site, and right is an image of the implantation position in 2 weeks after removing the scaffold. (C) The H&E staining of PCL, PH and GPH group in 2 weeks (a–c) and 6 weeks (d–f). *Indicates the location of the scaffolds. (D) The H&E staining of normal tissue. (E) Quantification of neutrophils in different groups. The data are shown as the means ± standard deviation from three independent experiments. ***P < 0.001 indicates significant differences between the indicated columns.

