Figure 3.
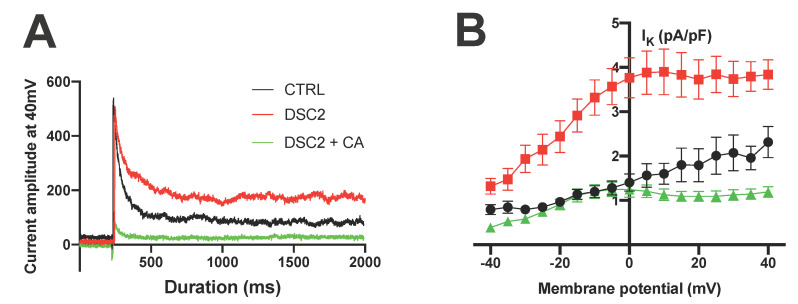
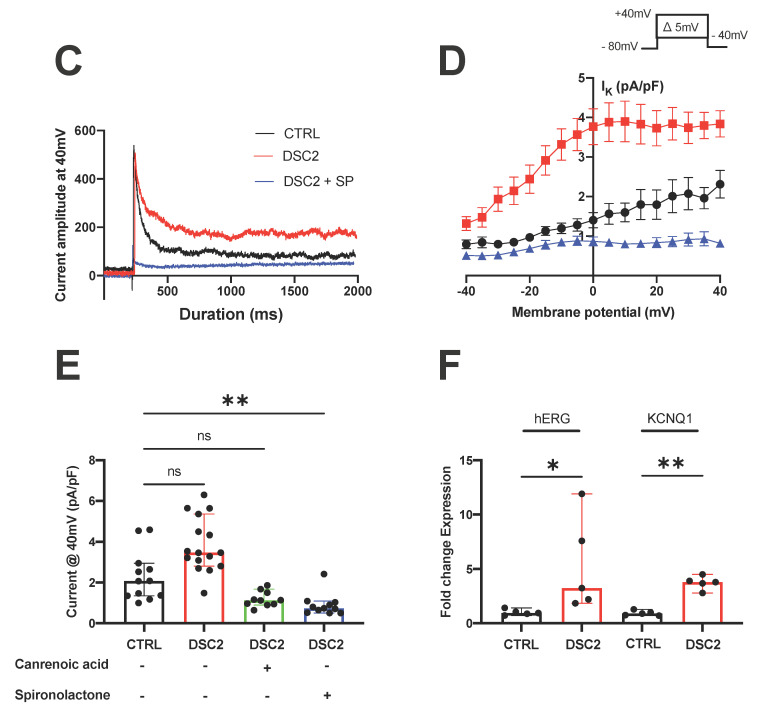
Effect of Canrenoic Acid on Potassium Channels. (A) Raw traces of K+ currents at +40 mV in control (black), DSC2 (red), and DSC2 + CA (green) condition and (B) potential current curves corresponding (CTRL n = 12; DSC2 n = 15; DSC2 + CA n = 10). (C) Raw traces of K+ currents at +40 mV in control (black), DSC2 (red), and DSC2 + SP (blue) condition and (D) potential current curves corresponding (CTRL n = 12; DSC2 n = 15; DSC2 + SP n = 11). (E) Values of Current amplitude at 40 mV for the different groups. (F) RT-qPCR results of fold change expression for hERG and KCNQ1 gene in CTRL and DSC2 hiPSC−CM. The results are represented with the median and 95% confidence interval. The stars * correspond to the difference from the control. ns not statically significant, * p < 0.05, ** p < 0.01 (Kruskal–Wallis test).


