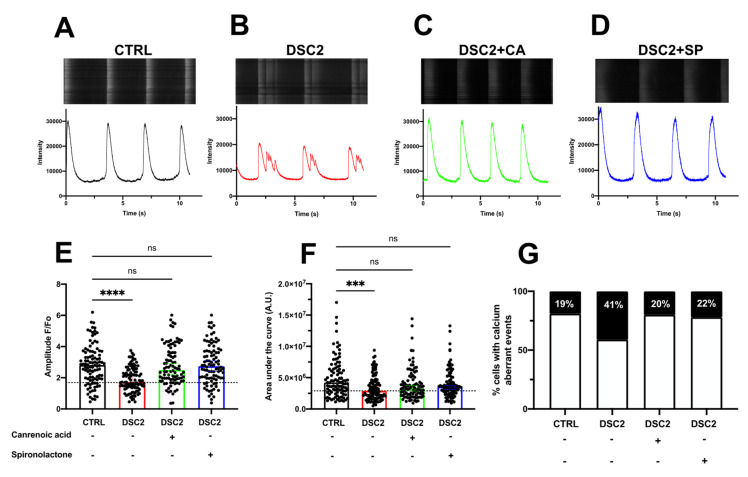
Figure 4.
Effect of Canrenoic Acid on Calcium handling. Examples of spontaneous Ca2+ transient recorded in control (A) (black; n = 100), DSC2 (B) (red; n = 101), DSC2 + CA (C) (green; n = 92), and DSC2 + SP (D) (blue; n = 94). Values of amplitude (E,F), the area under the curve (AUC) of Ca2+ transients, and (G) percentage of cells presenting Ca2+ aberrant events for the different conditions. Results are represented with the median and 95% confidence interval. The stars * correspond to the difference from the control. ns not statically significant, *** p < 0.001 **** p < 0.0001 (Kruskal–Wallis test).

