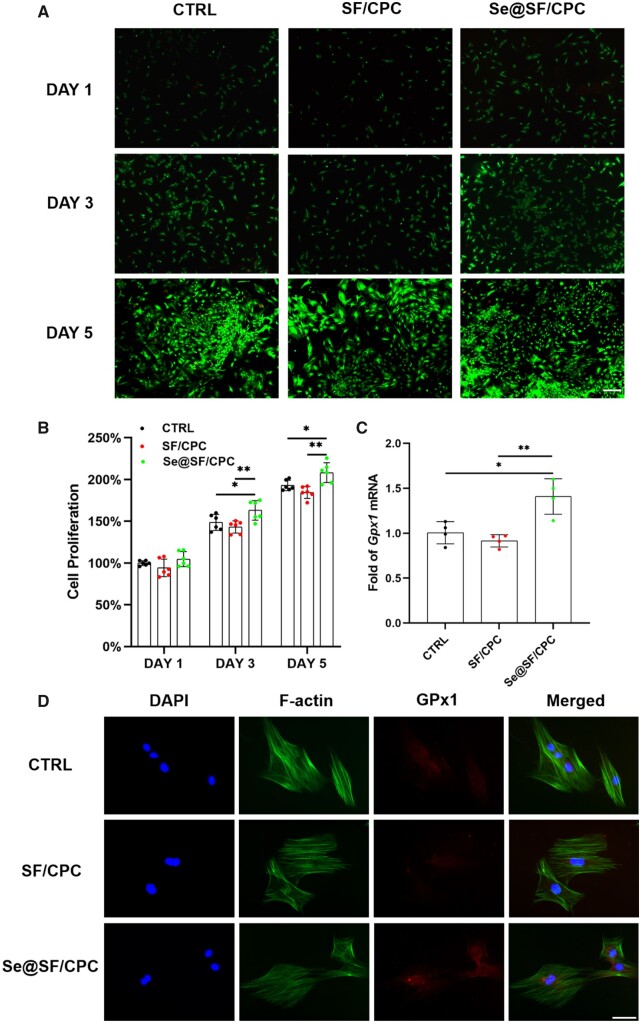
Figure 6.
Biocompatibility of modified bone cement and the GPx1 expression. OP-BMMSCs were cultured using the leached solution of SF/CPC and Se@SF/CPC, while cell culture medium without served as the CTRL group. (A) Cell viability was compared by a live/death staining assay. Scale bar = 500 μm. (B) Cell proliferation was evaluated by CCK-8 assay between the groups of the SF/CPC, Se@SF/CPC and CTRL, n = 6. (C) The Gpx1 gene expression of OP-BMMSCs was quantified with real-time RT-PCR, n = 4. (D) The GPx1 protein expression of OP-BMMSCs were detected by immunofluorescence assay. Scale bar: 100 μm. Values represent mean ± SEM. Statistically significant differences are indicated by * where P < 0.05 or ** where P < 0.01 between the indicated groups.

