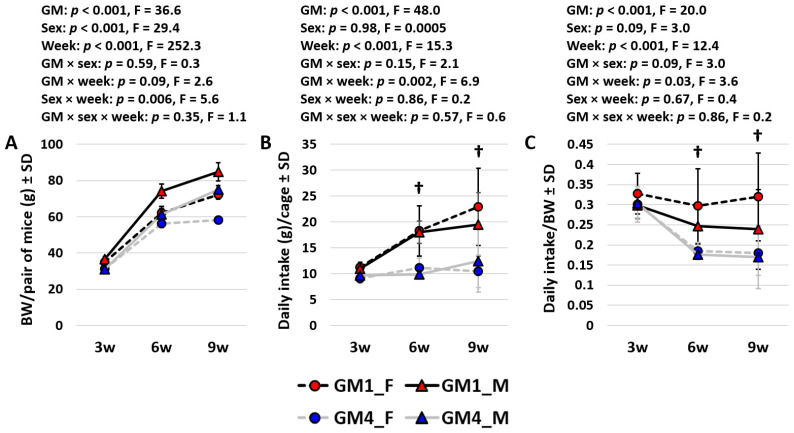
Figure 3.
Line plots showing the mean (±SD) body weight (BW) (A), total daily intake (B), and BW-adjusted daily intake (C) in cages housing pairs of female (F) or male (M) mice colonized with GM1 or GM4 at three (3 w), six (6 w), and nine weeks (9 w) of age (n = 5–6 cages/sex/GM). Statistical analysis was performed using three-way ANOVA. Daggers indicate significant GM-dependent differences in post hoc comparisons.

