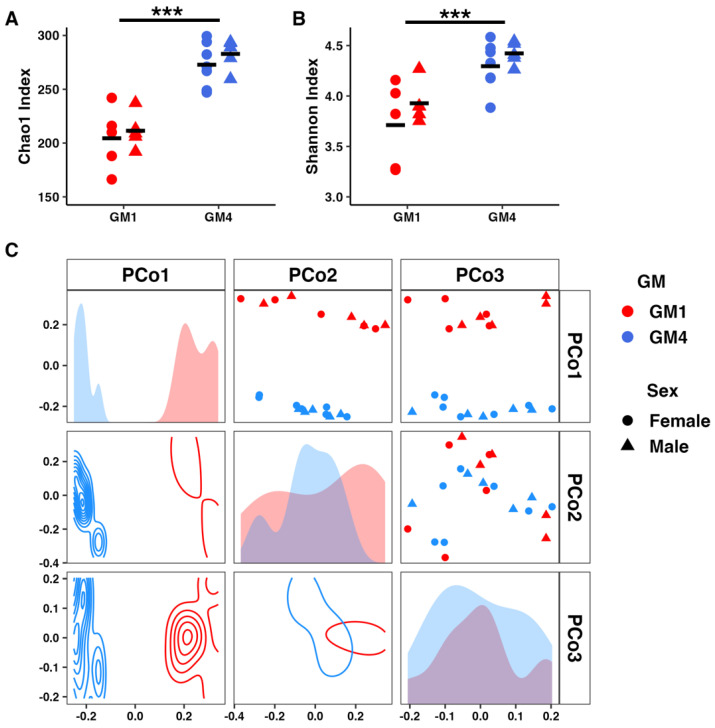
Figure 5.
Dot plots showing detected richness (A) and Shannon diversity (B) across the cages used in the intake study, and principal coordinate analysis (PCoA) matrix depicting microbial community structure along the first three principal coordinates using Bray–Curtis distances (C). Dot plots depict individual samples along two axes. Density plots depict sample distribution along two axes. Histograms depict sample distribution along a single axis. Triple asterisk indicates p < 0.001.

