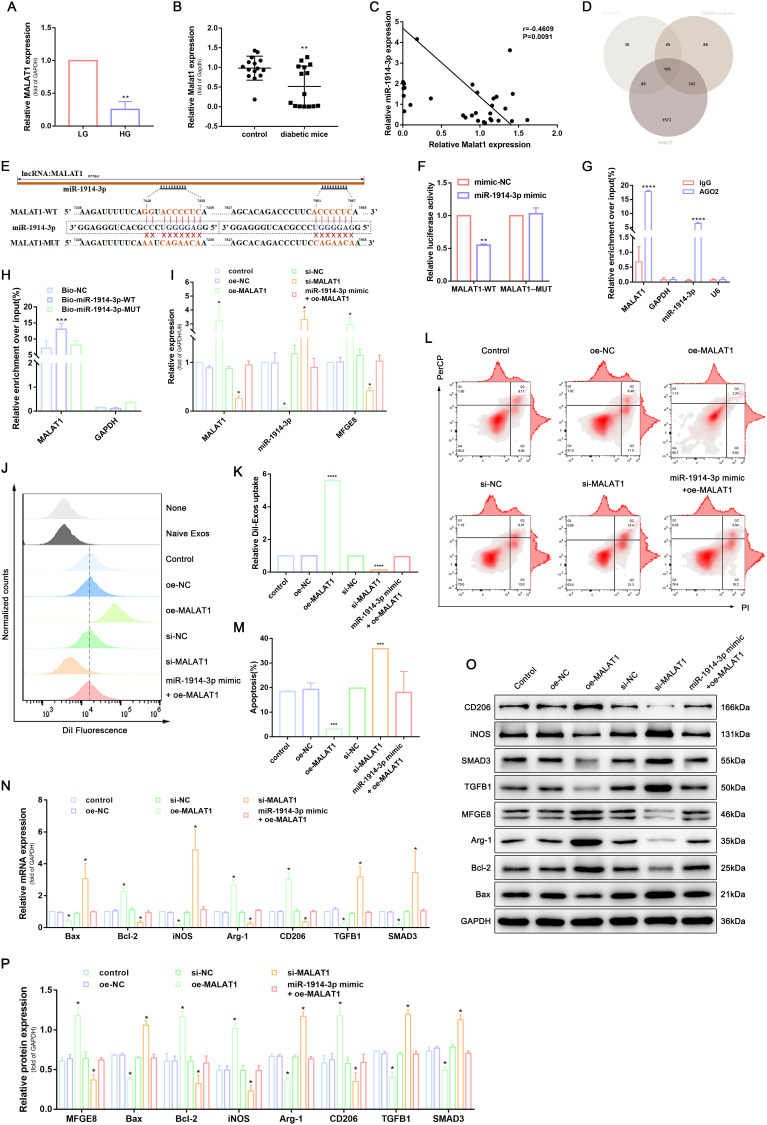
Figure 3.
MALAT1 competitively bound to miR-1914-3p to inhibit the activity of the TGFB1/SMAD3 signaling pathway and affect macrophage phagocytosis, apoptosis, and polarization. (A) MALAT1 expression in a normal medium or high glucose medium, determined by qRT-PCR. (B) MALAT1 expression in wound tissue from normal mice or diabetic mice, determined by qRT-PCR. (C) The correlation between MALAT1 and miR-1914-3p expression, measured in 31 mice skin by Spearman correlation analysis. (D) Predicted target miRNAs of MALAT1 by three online databases (ENCORI, DIANA-LncBase and RNA22). (E) Predicted binding sites between MALAT1 and miR-1914-3p by bioinformatics database. (F) Luciferase activity of MALAT1-WT and MALAT1-MUT detected by dual-luciferase reporter gene assay. (G) Relative enrichment of Ago2 by MALAT1 and miR-1914-3p detected by RIP assay. (H) Relative enrichment of MALAT1 detected by RNA pull-down. (I) MALAT1, miR-1914-3p and mRNA expression of MFGE8 expression, determined by qRT-PCR. (J and K) Uptake of DiI-labelled KCs-Exo by PMA-treated THP-1 cells, measured by flow cytometry analysis. (L and M) Apoptosis in PMA-treated THP-1 cells, measured by flow cytometry analysis. (N) mRNA expression of apoptosis-related factors (Bax and Bcl-2), macrophage polarization-related surface markers (iNOS, Arg-1 and CD206), TGFB1 and SMAD3, determined by qRT-PCR. (O and P) Protein expression of apoptosis-related factors (Bax and Bcl-2), macrophage polarization-related surface markers (iNOS, Arg-1 and CD206), MFGE8, TGFB1 and SMAD3, normalized to GAPDH, determined by Western blot analysis. *p < 0.05, **p < 0.01, ***p < 0.001, ****p < 0.0001 versus the control group. Measurement data were expressed as mean ± SD. Comparison between two groups was conducted using independent sample t test. One-way ANOVA was used for data comparison among multiple groups, followed by Tukey’s post hoc test. The experiment was repeated independently three times.

