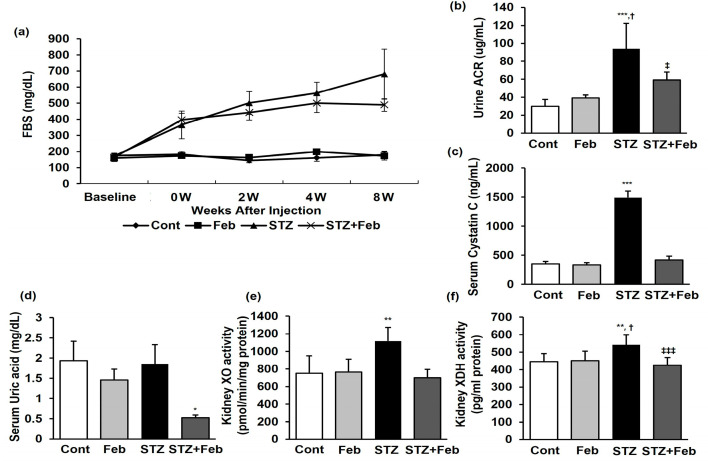
Figure 1.
The changes in glucose, renal function, and XOR activities in STZ-induced diabetic mice with or without febuxostat treatment. (a) Fasting blood glucose, (b) Urine Albumin/Creatinine ratio, *** p < 0.001 vs. Cont, † p < 0.05 vs. Feb, and ‡ p < 0.05 vs. STZ group. (c) Serum cystatin C, *** p < 0.001 vs. other groups, (d) serum uric acid, * p < 0.05 vs. other groups, (e) kidney XO activity, ** p < 0.01 vs. other groups, (f) kidney XDH activity, ** p < 0.01 vs. Cont, † p < 0.05 vs. Feb, and ‡‡‡ p < 0.001 vs. STZ group.

