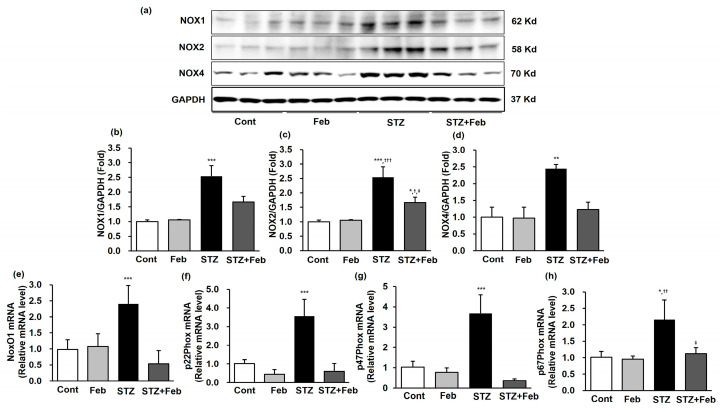
Figure 4.
Representative images and quantitative analysis of NADPH oxidase and the mRNA expression of NADPH oxidase subunits in STZ-induced diabetic mice with or without febuxostat treatment. (a) Representative immunoblots of NOX1, NOX2 and NOX4 expressions. (b) Quantitative analyses for NOX1/GAPDH, *** p < 0.001 vs. other groups. (c) Quantitative analyses for NOX2/GAPDH, * p < 0.05 and *** p < 0.001 vs. Cont, † p < 0.05 and ††† p < 0.001 vs. Feb and ‡ p < 0.05 vs. STZ group. (d) Quantitative analyses for NOX4/GAPDH, ** p < 0.01 vs. other groups. (e) NoxO1 mRNA, *** p < 0.001 vs. other groups. (f) p22phox mRNA, *** p < 0.001 vs. other groups. (g) p47phox mRNA, *** p < 0.001 vs. other groups. (h) p67phox mRNA, * p < 0.05 vs. Cont, †† p < 0.01 vs. Feb and ‡ p < 0.05 vs. STZ group.

