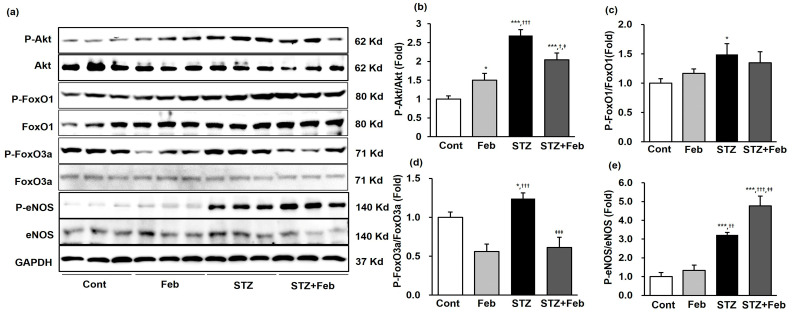
Figure 5.
Representative images and quantitative analysis for Akt, FoxOs and eNOS expressions in STZ-induced diabetic mice with or without febuxostat treatment. (a) Representative immunoblot showing Akt, FoxOs and eNOS expression levels in mouse kidneys. (b) Quantitative analyses for phosphor-Ser473 Akt/total Akt, (c) Quantitative analyses for phospho-Ser256 FoxO1/total-FoxO1. (d) Quantitative analyses for phospho-Ser253 FoxO3a/total-FoxO3a. (e) Quantitative analyses for phospho-Ser1173 eNOS/total eNOS, * p < 0.05 and *** p < 0.001 vs. Cont, †† p < 0.01 and ††† p < 0.001 vs. Feb and ‡ p < 0.05, ‡‡ p < 0.01, and ‡‡‡ p < 0.001 vs. STZ group.

