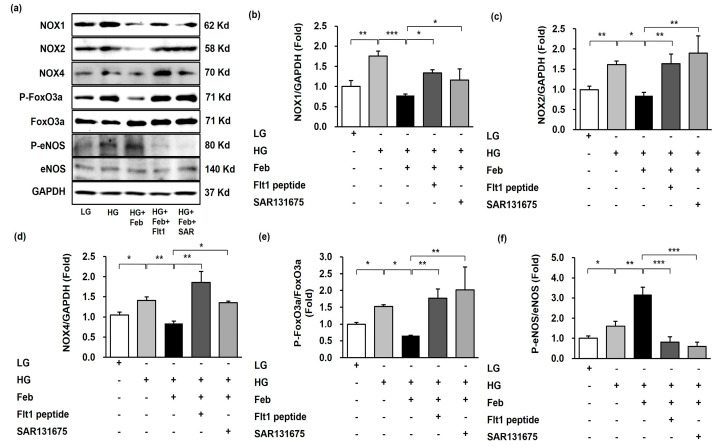
Figure 7.
Representative images and quantitative analysis for NOX1, NOX2, NOX4, FoxO3a, and eNOS according to VEGFR1 or VEGFR3 inhibition in HG-treated human GECs with or without febuxostat. (a) Representative immunoblot images of NOX1, NOX2, NOX4, FoxO3a and eNOS. (b) Quantitative analyses of NOX1/GAPDH. (c) Quantitative analyses of NOX2/GAPDH. (d) Quantitative analyses of NOX4/GAPDH. (e) Quantitative analyses for phospho-Ser253 FoxO3a/total FoxO3a. (f) Quantitative analyses for phospho-Ser1173 eNOS/total eNOS. * p < 0.05, ** p < 0.01, and *** p < 0.001, Fit1: anti-Flt1 peptide, SAR: SAR131675.

