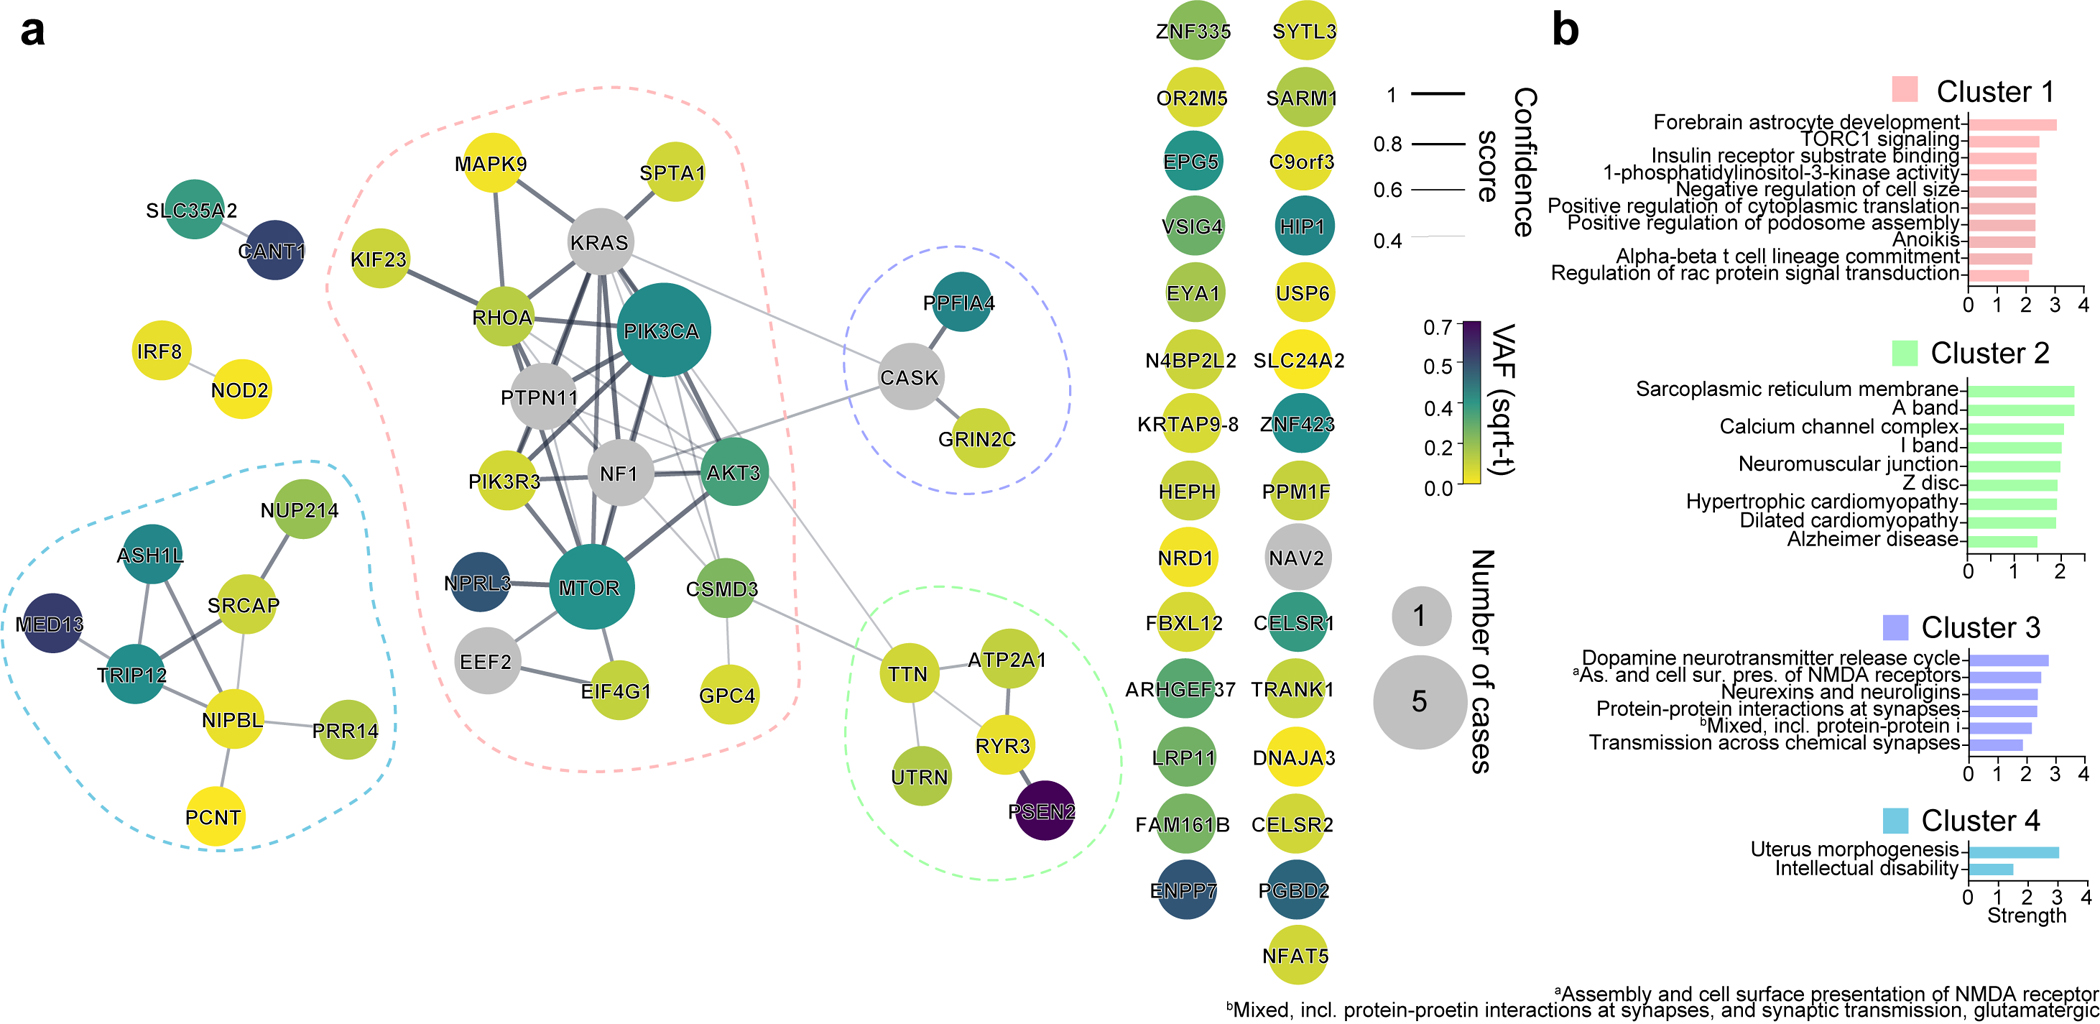
Extended Data Fig. 4. Four major gene networks were reconstructed from the WES dataset.

(a) STRING DB pathway analysis of the 59 MCD discovered genes and six novel genes (a total of 65 genes) from recent publications identifies MTOR/MAP kinase pathway (pink, Cluster 1), Calcium dynamics (green, Cluster 2), Synapse (purple, Cluster 3), Gene expression (blue, Cluster 4). Edge thickness: confidence score calculated by STRING. Size and color of a node: square root transformed (sqrt-t) number of patients carrying a given mutation and average VAF across all patients, respectively. Non-clustered orphan genes are listed on the right. (b) Gene Ontology (GO) analysis results confirmed the functions of compositions in each network. Top GO terms or KEGG pathways. Strength calculation and cluster generation were performed by STRING.
