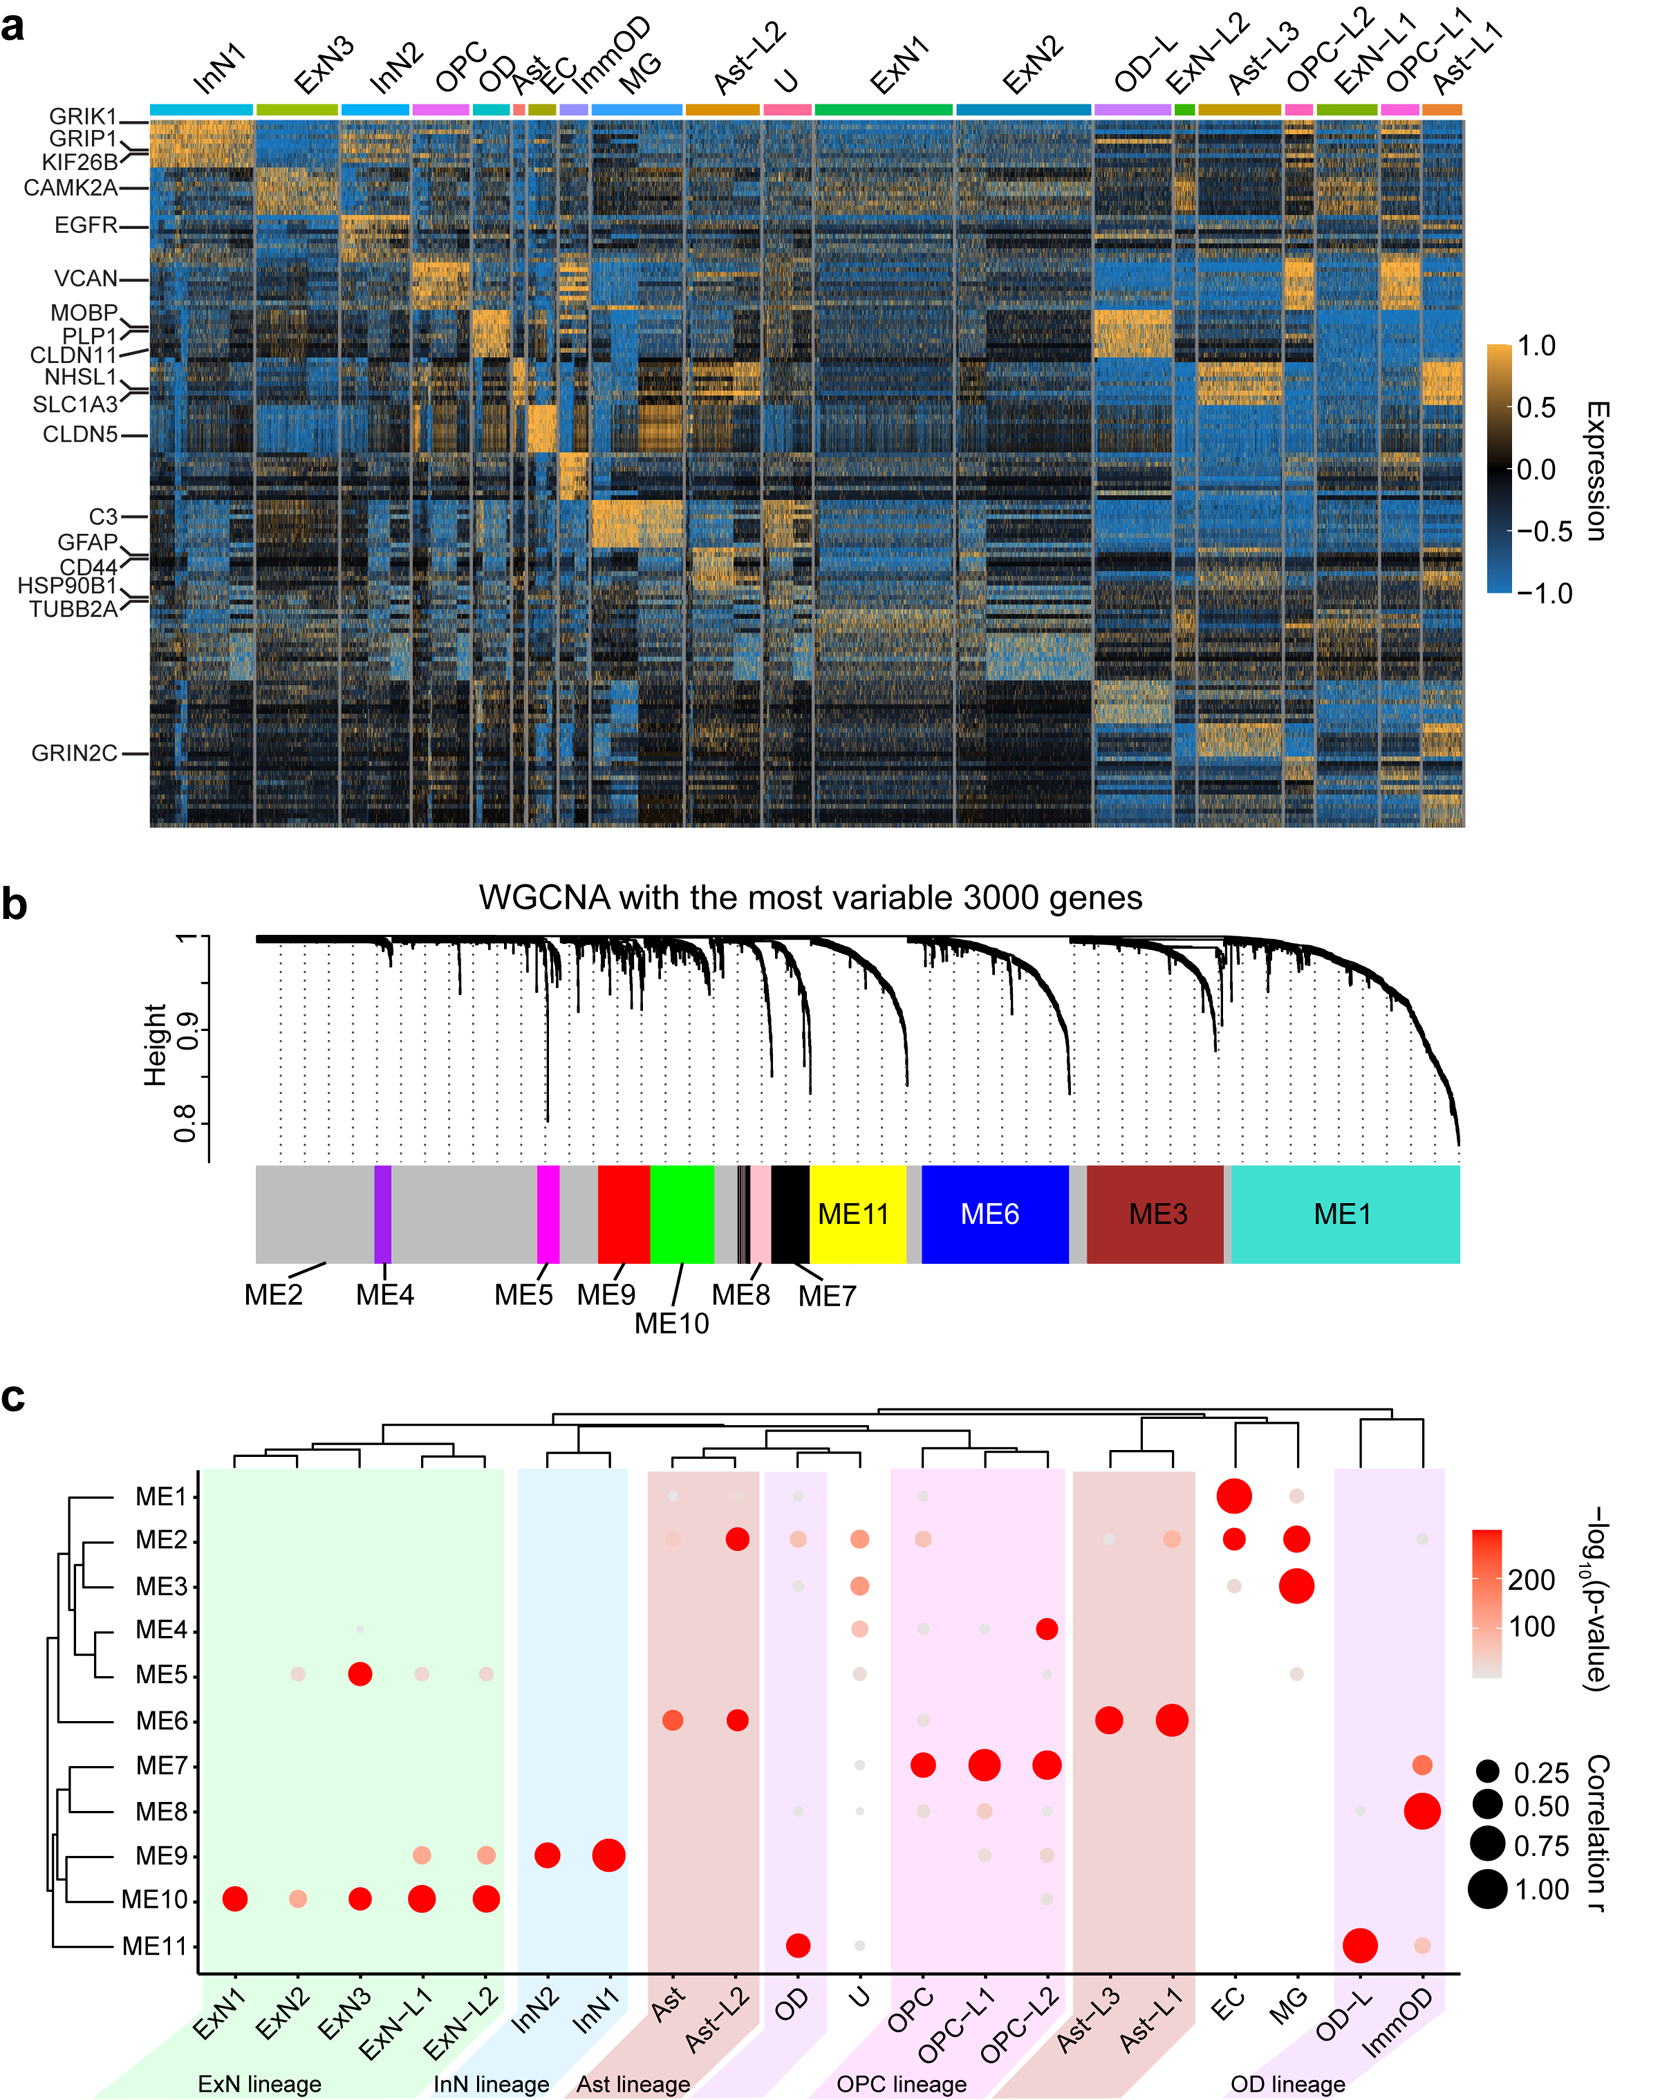
Extended Data Fig. 7. Cell-type identification by DEGs and WGCNA in the MCD snRNAseq dataset.

(a) DEG analysis using FindAllMarker function in Seurat v4 package. The top 10 genes for each cluster were presented. Some notable marker genes are presented on the left side. Color: scaled gene expression level. (b) Description of WGCNA. The most variable 3000 genes were used for generating six co-expression module eigengenes (ME1 to ME11). The members of each ME are described in Supplementary Table 5b. (c) Enrichment of module eigengenes in cell type clusters. Atypical clusters showing similar patterns with a normal cell cluster were classified as the same lineage. We identified 5 different lineages (Ast, OD, ExN, InN, OPC) coded as different colors. Notably, Ast-L1/2/3 and OPC-L1/2 show excessively increased expression of ME6 or ME7, Ast or OPC signature ME, respectively. OPC-L2 shows upregulation of ME4, related to the cell cycle, implying that HME has many over-proliferating OPC-L cells. Excitatory neuronal lineage typically expresses ME5 and ME10, but ExN-L1/2 also shows increased expression of ME9, a signature of inhibitory neurons, compared to ExN1/2/3. OD-L cells are classified as OD lineage because they express excessive ME11, a signature to OD. U cluster, dominant in TSC, does not show a clear signature. The size and color of the dot plot are the Pearson correlation coefficient and corresponding non-adjusted asymptotic p-value derived from a two-sided Student’s t-test, respectively.
