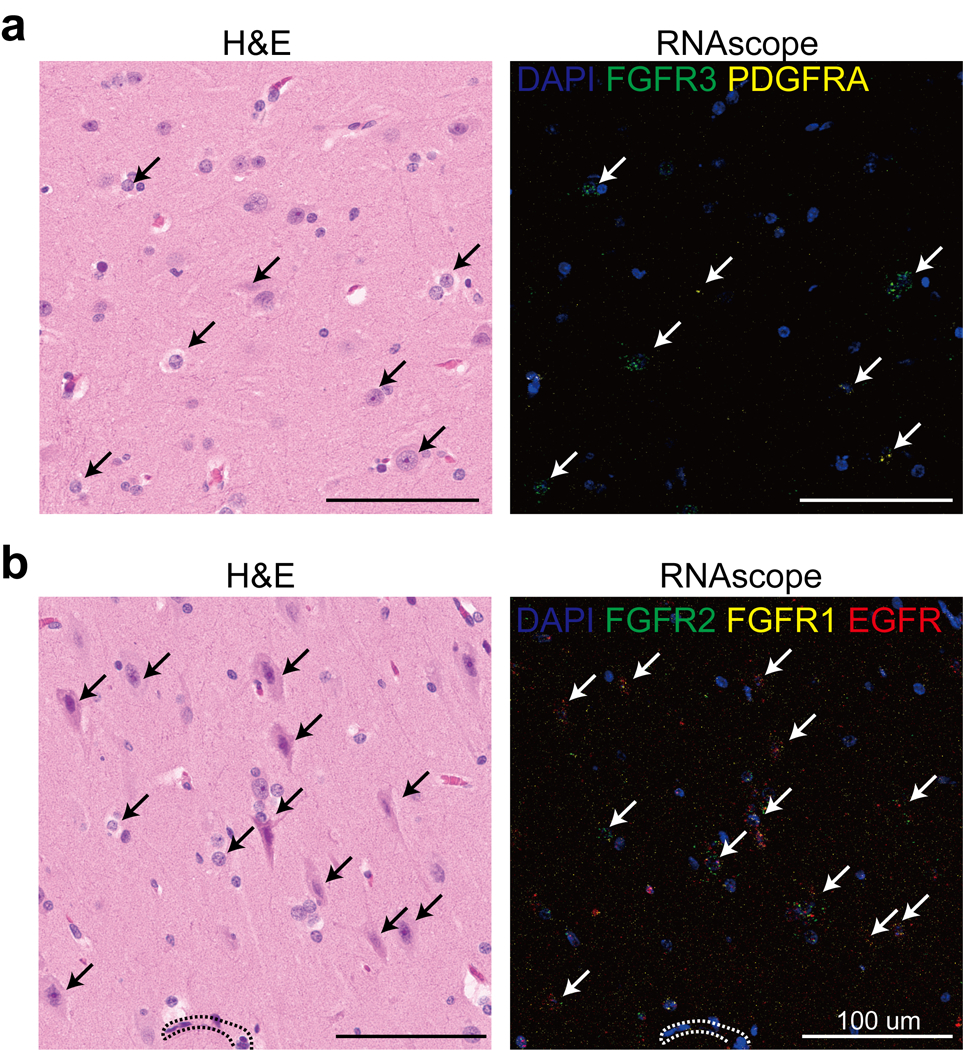
Extended Data Fig. 8. The validation of the snRNAseq result from HME-6593 shows that MCD dominant clusters are highly correlated with dysplastic cells in MCD.

(a-b) H&E (left) and RNAscope (right) for genes expressed highly in MCD brain (FGFR2, FGFR1, EGFR, top) or (FGFR3, PDGFRA bottom). Dashed lines: blood vessels. White/black arrows: dysplastic cells. One representative section is shown for each probe combination.
