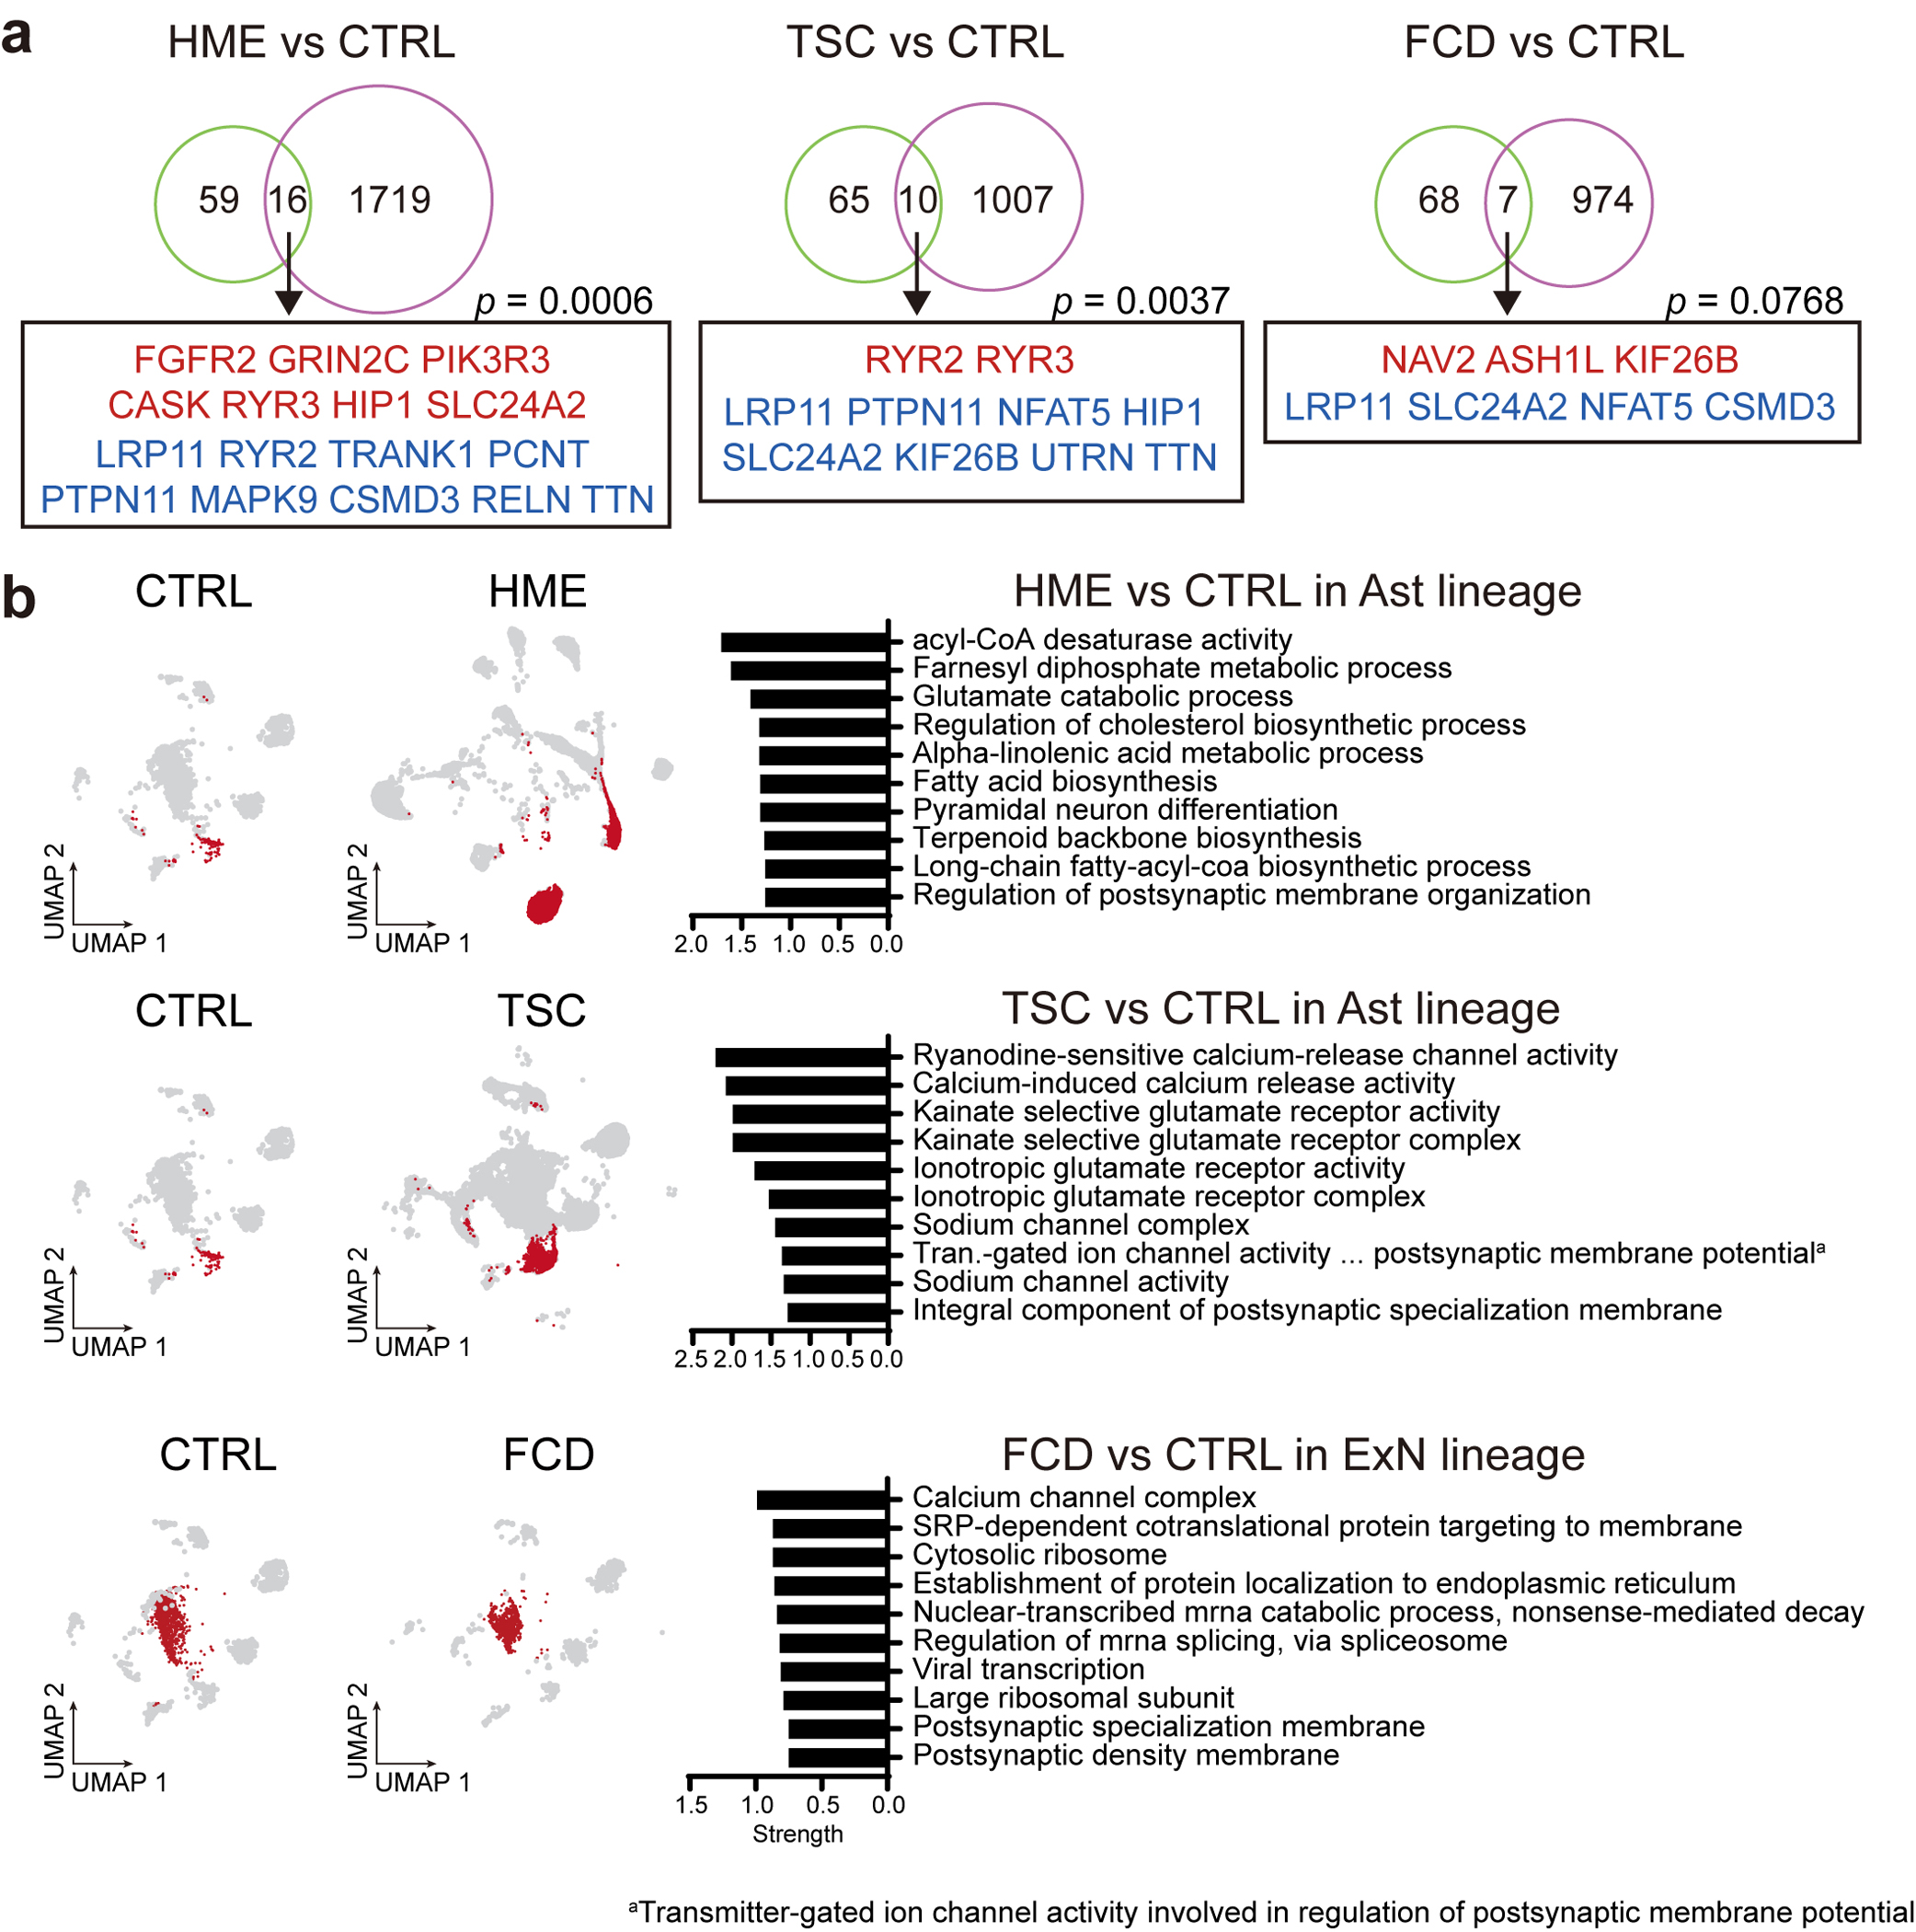
Extended Data Fig. 10. Functional implication of MCD genes in MCD snRNAseq dataset.

(a) The 75 MCD genes overlap with DEGs of MCDs in contrast to controls. p-values derived from permutation tests (10,000 times) show a chance to show this overlap in a random sampling of DEGs from 19909 protein-coding genes used in these DEGs. Red or blue coloring of gene names indicates upregulated or downregulated DEGs in MCDs compared to CTRLs, respectively. HME and TSC show significant overlap with the MCD genes whereas an FCD case with low VAF did not, which is probably because of low VAF. One-sided permutation test. (b) Cell-lineage specific DEGs compared to the according to normal cell lineage of CTRL represent alterations of mTOR downstream pathways, calcium dynamics, and synaptic functions across. Red dots in UMAPs indicate the cells that participated in the comparison. Top 10 enriched GO or KEGG terms representing lineage-specific DEGs.
