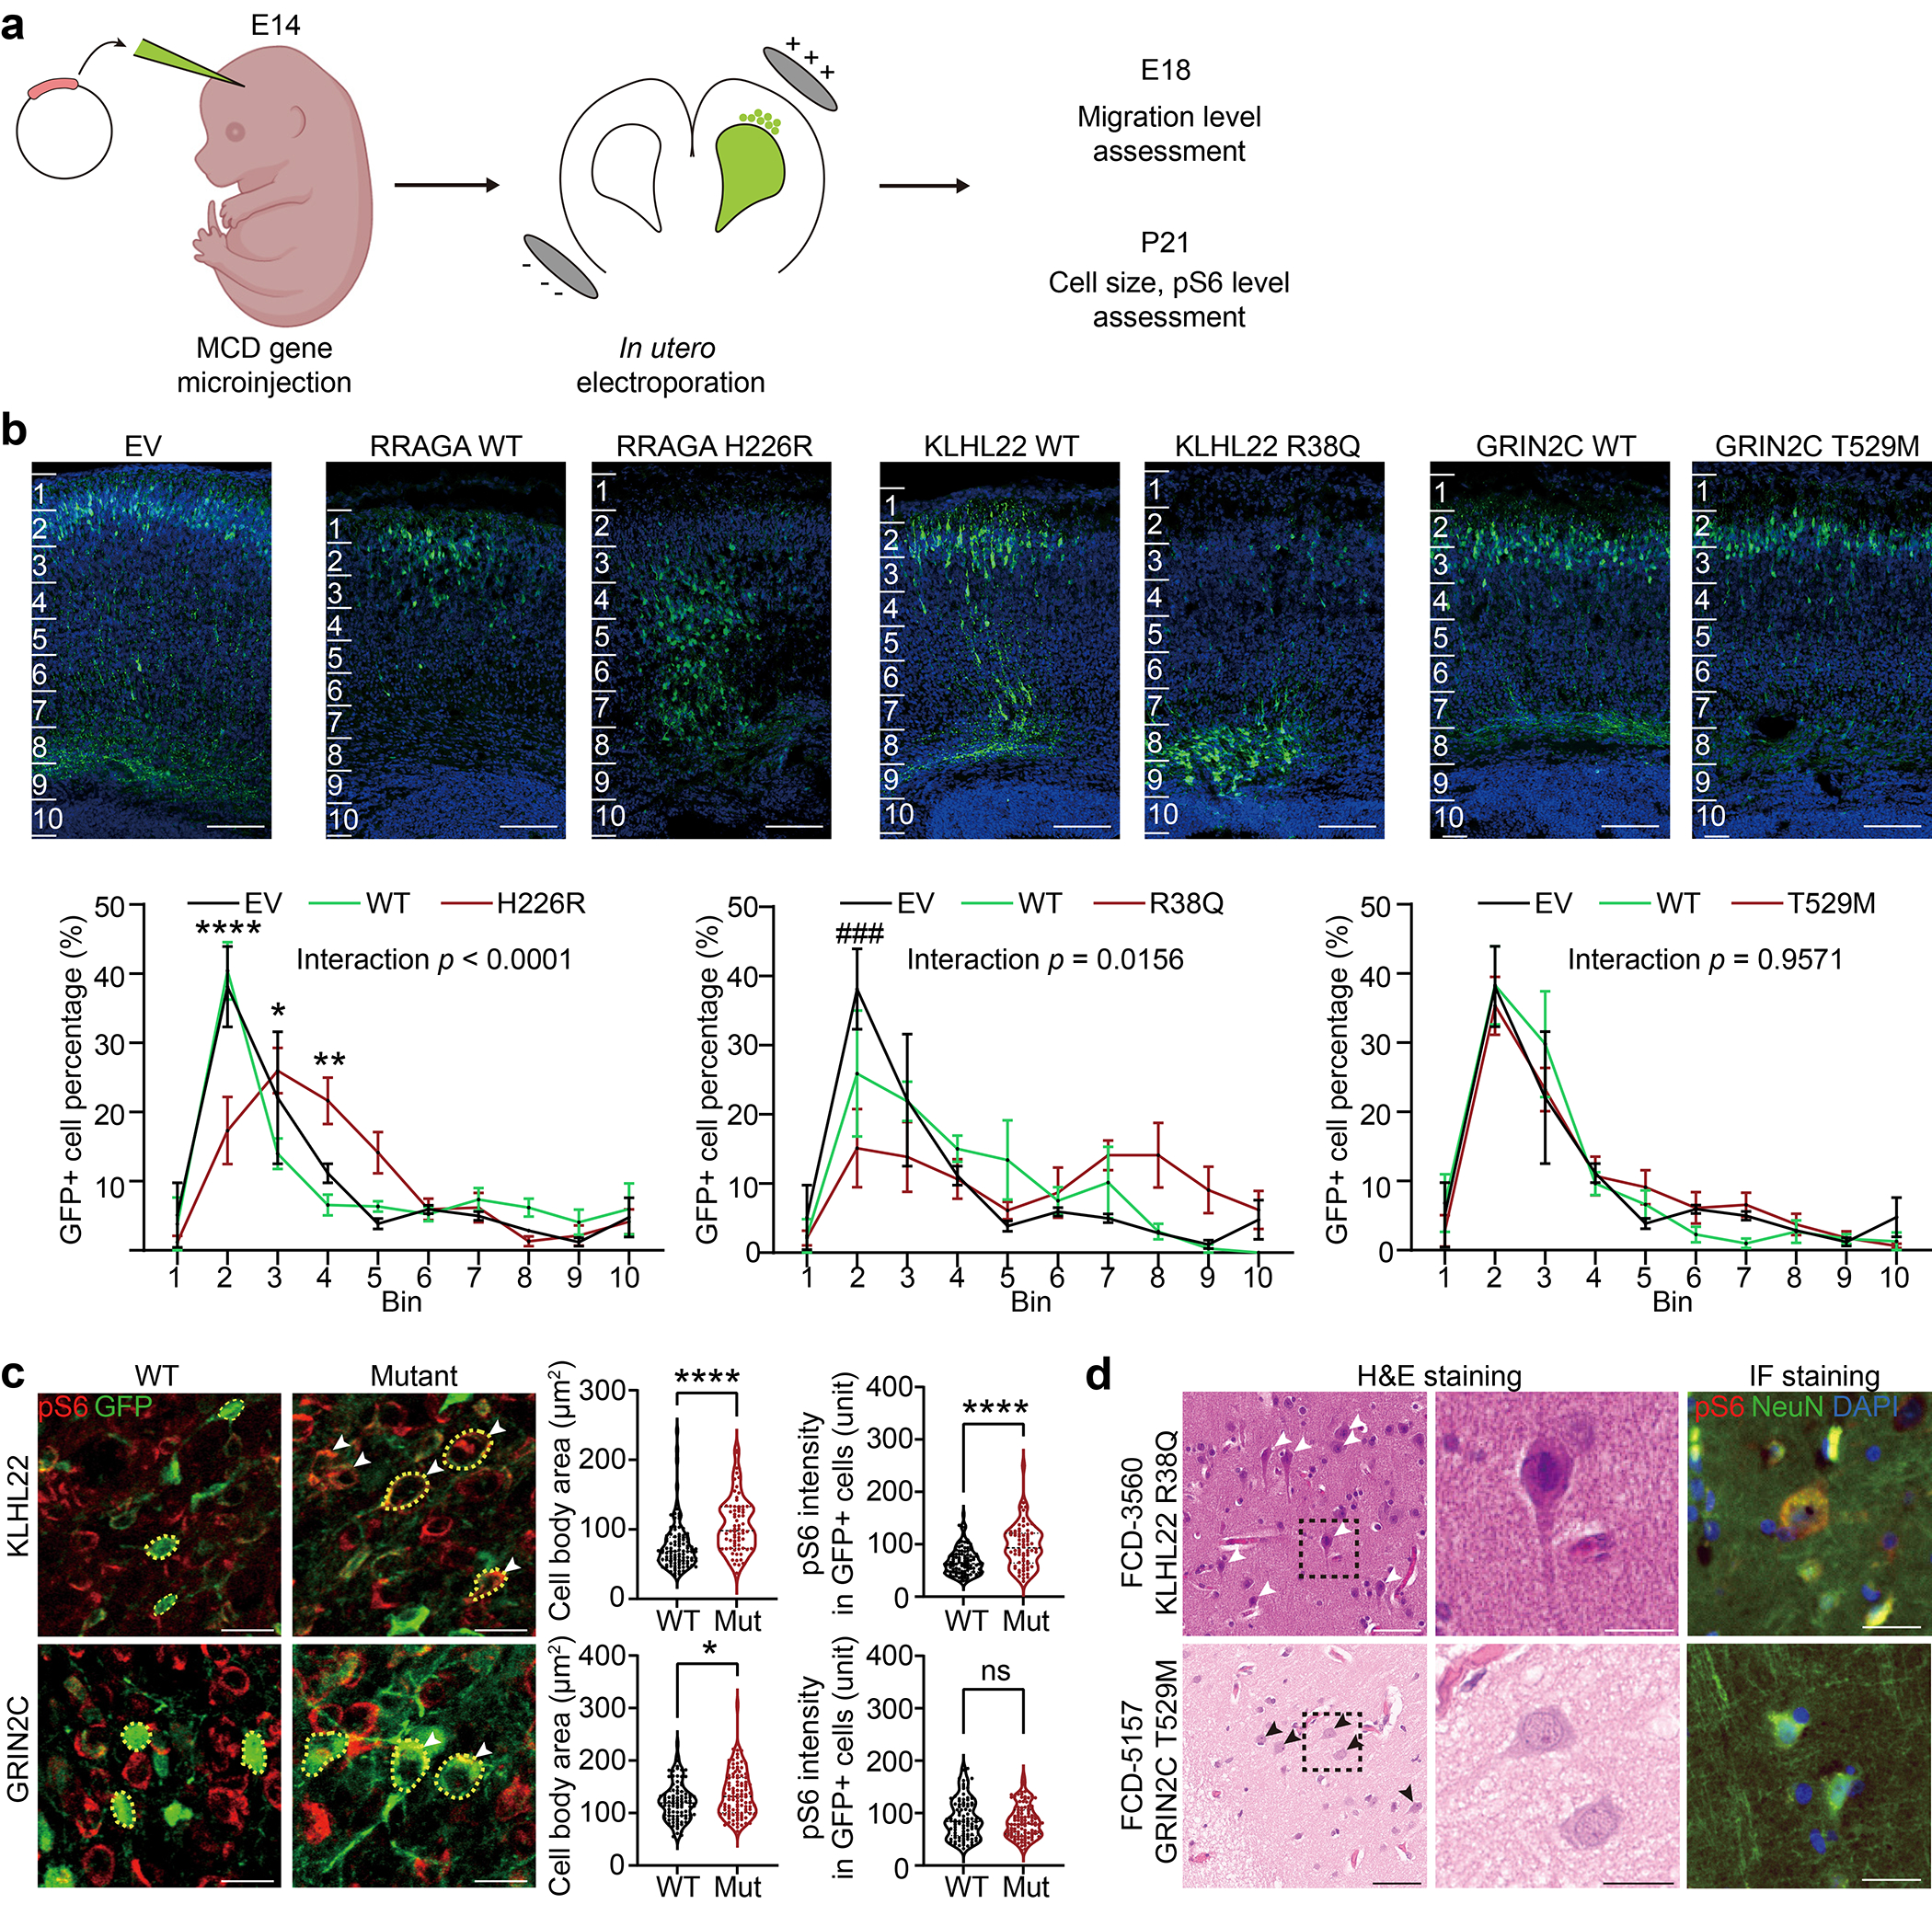
Figure 3. Selected novel MCD somatic variants show functional defects in embryonic mouse brain and patient samples.

(a) Validation of candidate mosaic variants in mice. (b) Two different mutations in novel FCD type II genes, RRAGA H226R and KLHL22 R38Q, but not a novel FCD type I gene, GRIN2C, disrupt cellular radial migration from the subventricular zone (SVZ). Below: two-way ANOVA and Sidak multiple comparisons with p-values of interaction between genotype and bin factor. * or # indicates a p-value in comparison between WT and mutant group, or EV and mutant group respectively. Ten bins from the surface of the cortex (top) to SVZ (bottom). Scale bar: 100 μm. Mean ± SEM (standard error mean). n=3, 3, 6, 3, 6, 4, 3 biologically independent animals for EV, RRAGA WT, RRAGA H226R, KLHL22 WT, KLHL22 R38Q, GRIN2C WT, and GRIN2C T529M, respectively. (c) Immunofluorescence in postnatal day 21 mouse cortices for KLHL22 and GRIN2C wild-type (WT) or mutant isoform. Neurons expressing mutant KLHL22 and GRIN2C recapitulate histological phenotypes shown in (d), with enlarged cell bodies (white arrow) compared to WT isoforms (WT control), whereas only neurons expressing KLHL22 but not GRIN2C mutant isoform display increased pS6 levels compared to control. Yellow dashed lines: examples of cell body size quantification. Two-tailed Mann-Whitney U-test. Dashed lines and dotted lines in the violin plots indicate median and quartiles, respectively. Scale bar: 20 μm. n=105 cells (3 mice), 70(3), 95(3), 107(3) for KLHL22 WT, KLHL22 R38Q, GRIN2C WT, and GRIN2C T529M, respectively. (d) H&E and phospho-S6 (pS6) staining of the resected brain from FCD-3560 and FCD-5157. One representative H&E or IF staining is shown for each patient case. The box area is zoomed in the middle image. Arrows: dysplastic cells. Right: Immunofluorescence (IF) for pS6 and NeuN. Note that dysplastic pS6-positive neurons with increased pS6 levels are present in FCD-3560 but not in FCD-5157. Scale bar: 60 μm on the left, 20 μm on the middle and right. ****p < 0.0001; *p < 0.05; ns, non-significant. ###p < 0.001. EV: empty vector.
