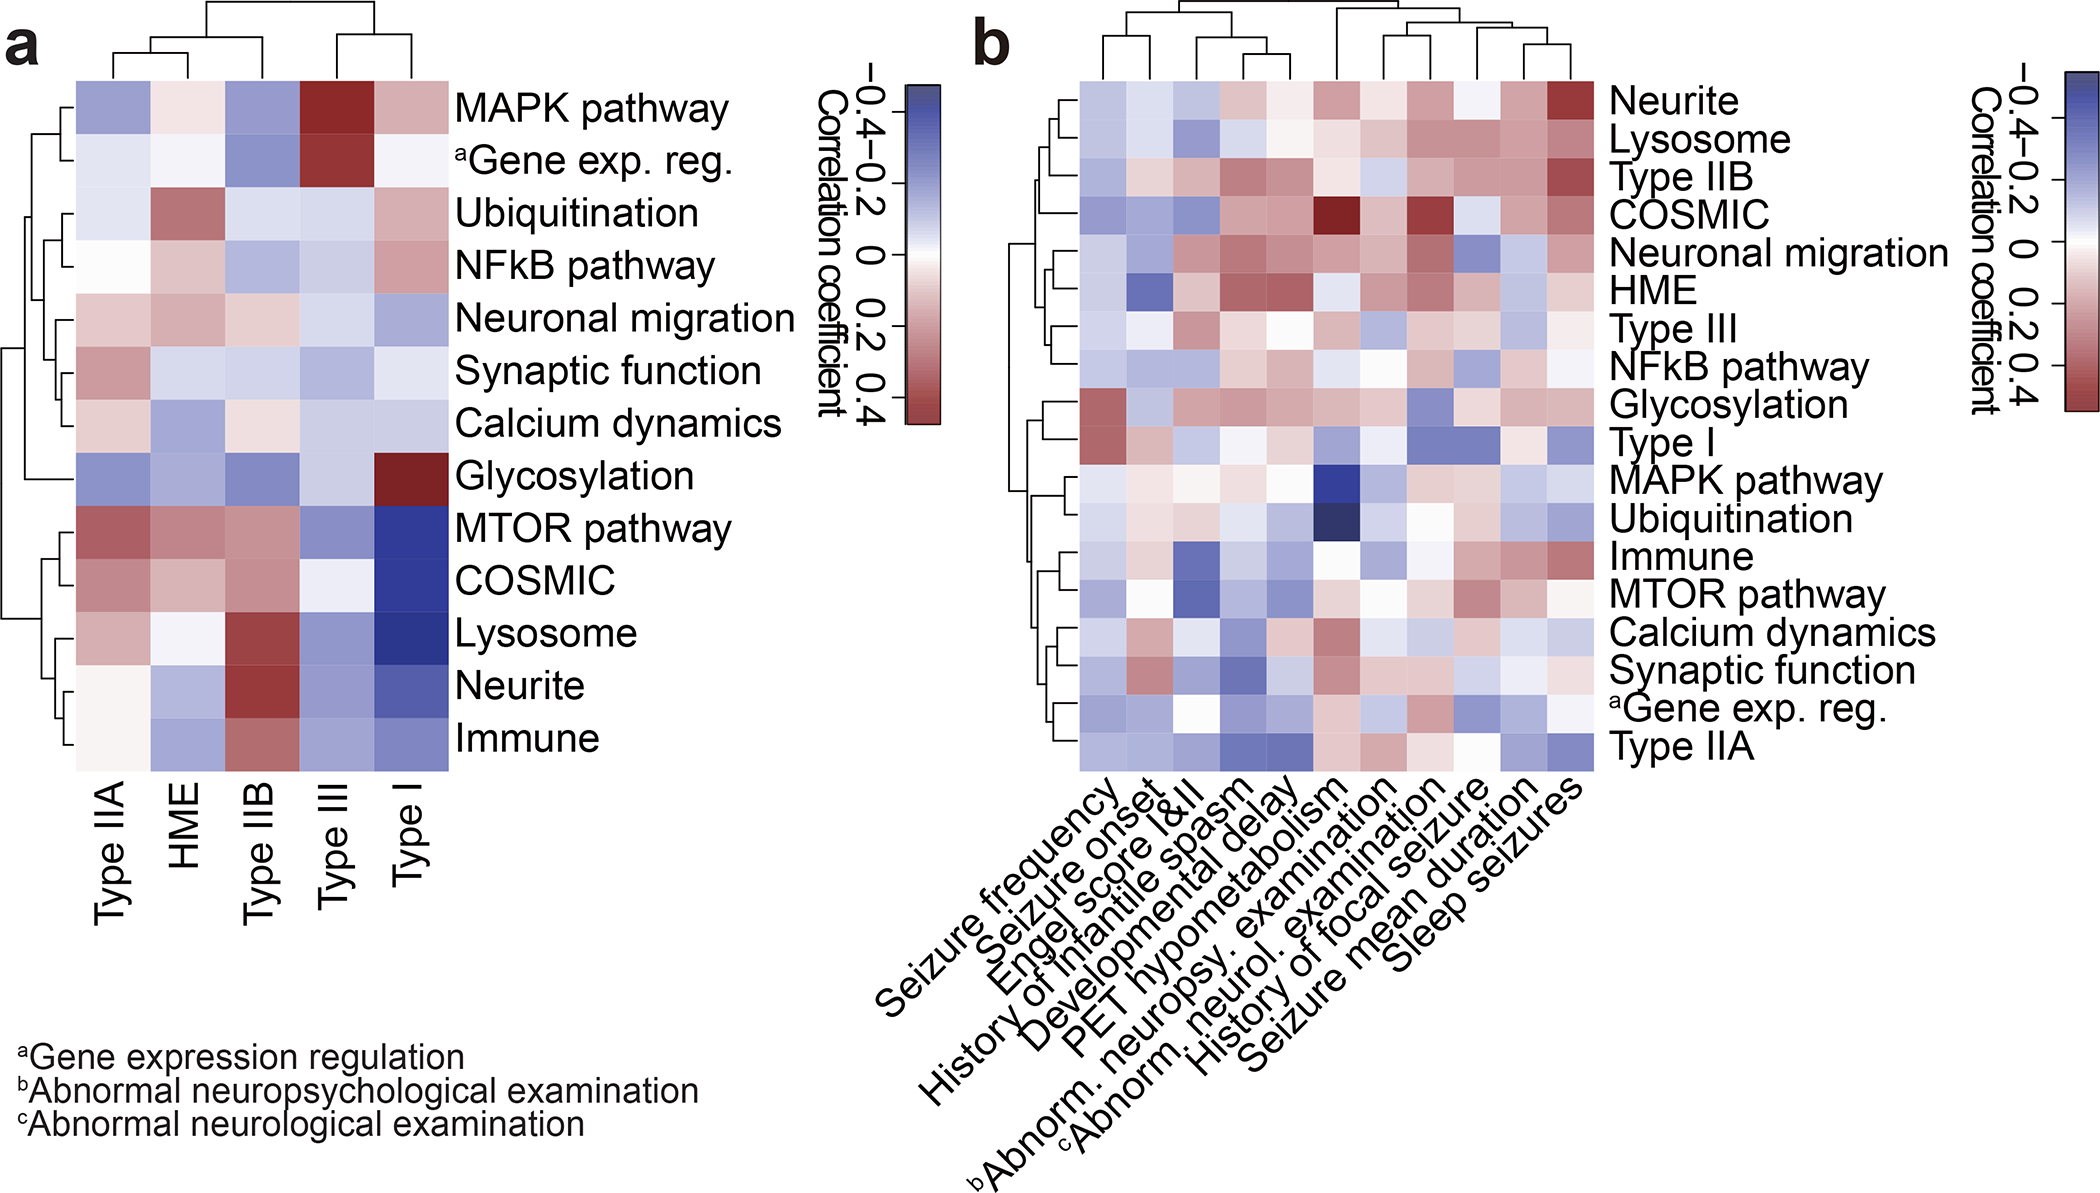
Figure 4. Clinical phenotypic outcomes correlate with genotype-based classifications in MCD.

(a) Correlation heatmap for classification based on genetic information (y-axis) vs. International League Against Epilepsy (ILAE) classification based on histology (x-axis) using Pearson correlation. Shade: the value of the Phi coefficient. Note that Type IIA and HME are enriched with mTOR and Ubiquitination genes, while Type I is enriched in Glycosylation and depleted in MTOR and COSMIC genes. HME: hemimegalencephaly. (b) Correlation between classification based on genetic information and various clinical phenotypes. Shade: the value of Phi (binary data) or Pearson (continuous) correlation coefficient. For example, positron emission tomography (PET) hypometabolism is enriched in COSMIC genes and depleted in the MAPK pathway, whereas abnormal neurological examination is enriched in COSMIC genes. Raw data are in Supplementary Table 4.
