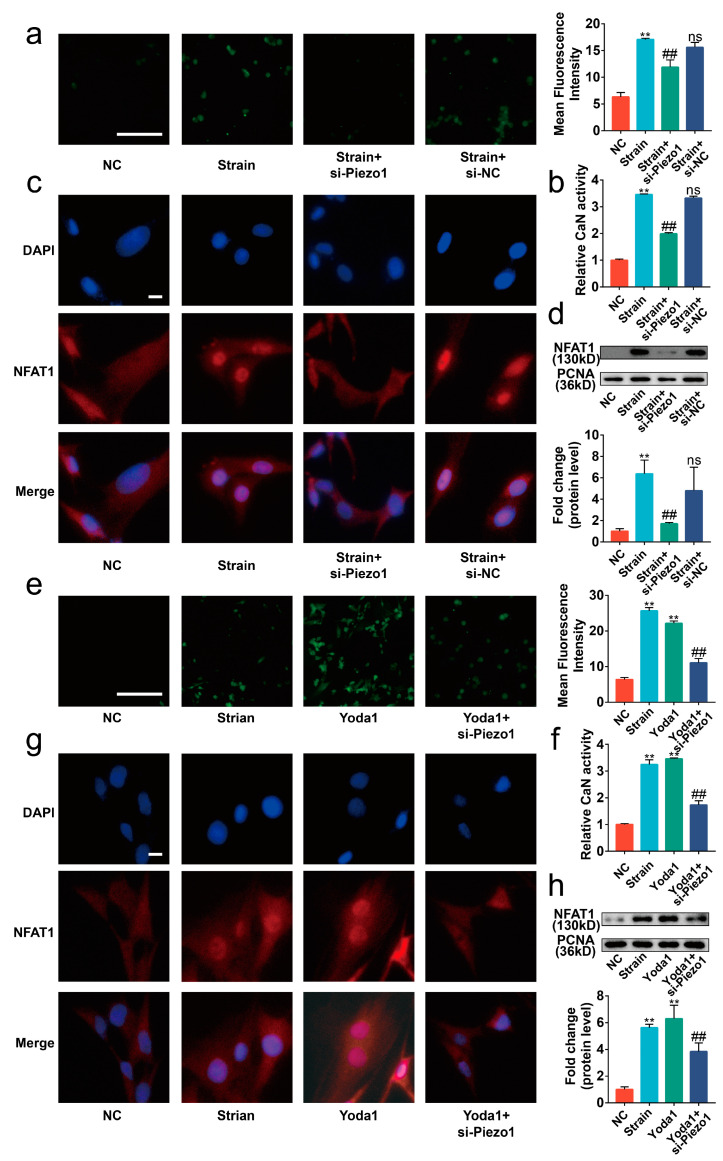
Figure 4.
Piezo1 activated the CaN/NFAT1 signaling axis under mechanical strain. (a,e) Representative image of the Flou-4 AM stain (n = 3), scale bar: 100 μm. (b,f) The activity of CaN is determined by the CaN Activity Kit (n = 3). (c,g) Representative immunofluorescence image of NFAT1 nuclear translocation in each group (n = 3), scale bar: 10 μm. (d,h) Western blot analysis of NFAT1 in chondrocyte nucleoprotein (n = 3). ** p < 0.01 vs. NC; ## p < 0.01 vs. strain or Yoda1; ns, no significant differences. One-way ANOVA with Bonferroni’s test for (a,b,d–f,h).

