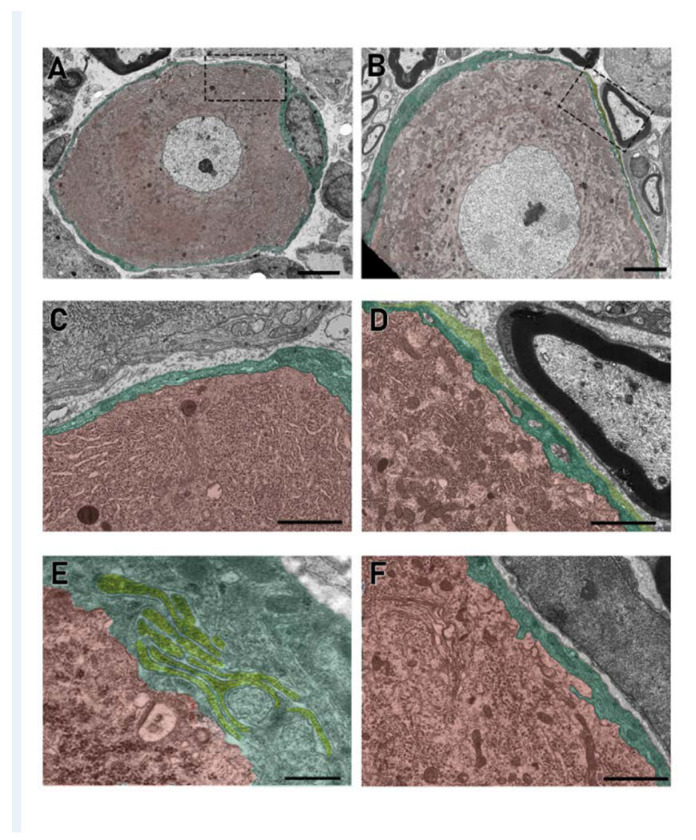
Figure 3.
Electron microscopy analysis of the DRG cells. (A,C): vehicle; (B,D–F): paclitaxel. Pictures show the different interactions between SGCs and neurons. Computer-aided virtual colors help in the visualization of different SGCs (yellow and green) and neurons (red). (D): Two SGCs (dark and light green) wrap the same neuron (red). (E): An example of different SGCs membrane projections generating a complex contact internal system (light green). (A,B) bar: 5 μm; (C,D) bar: 2 μm; (E) bar: 0.5 μm; (F) bar: 2 μm.

