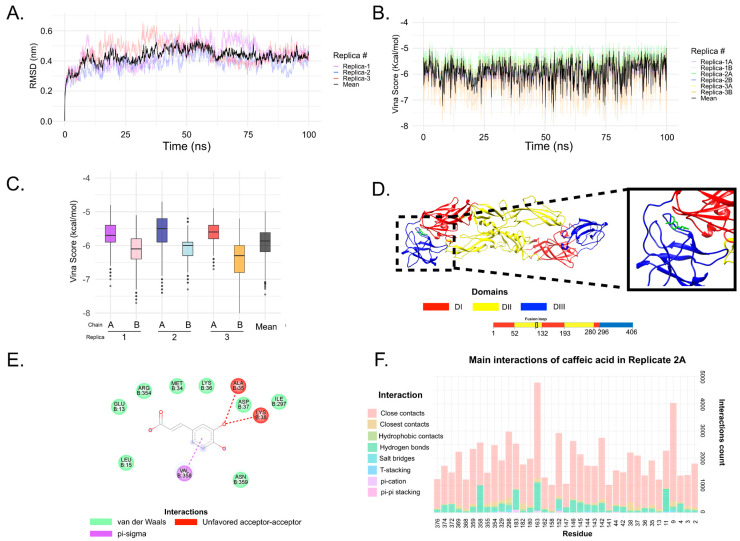
Figure 7.
MD and ensemble docking analysis. (A) RMSD behavior throughout the 100 ns trajectory for all replicates. Replicates are shown as transparent colored lines, and the average for the five replicates is represented as a black line. (B) Vina score from caffeic acid docking in each frame for all trajectories. Details of values (mean, max, min, etc.) for RMSD and Vina score are presented in Tables S2 and S3. (C) Box plot of Vina Score distribution. Replicate 3B performed better (lower Vina Score values) than the other replicates/chains. (D) Caffeic acid (green line) binding between DI/DIII domains (red and blue ribbons, respectively). This is a complex retrieved from replica 2, chain A. (E) 2D diagram of interaction of protein-ligand complex from panel (D). This figure was created using Discovery Studios. (F) Main interaction residues of protein E, replicate 2A. Note that most of the residues are interacting in DI (residues 1–51; 132–192; 280–294) and DIII (residues 296–406). The interaction count below 1000 was not plotted. This analysis of the protein–ligand interaction was conducted using the BINANA algorithm and a Python script developed in-house. Analysis of the main interaction residues from all replicates and chains can be seen in Figure S4.

