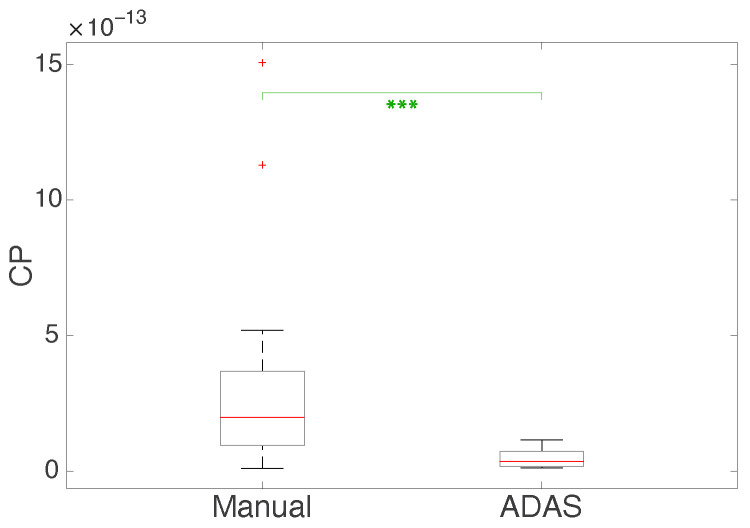
Figure 11.
Box plot of the CP parameter (SPR RMS × mean HR × beta power/EBR, with SPR in mV, HR in Beats Per Minute, beta power in μV2, and EBR in Blinks Per Minute) among subjects in the Manual and ADAS scenarios. The red lines correspond to the medians, the boxes to the first and third quartiles, the whiskers to the values based on the Interquartile Range (IQR) computation, and the plus sign markers to the outliers. The green asterisks refer to the p-values computed with the Wilcoxon test.

