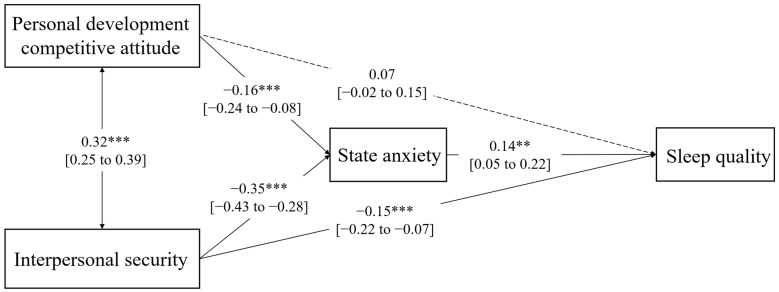
Figure 3.
Path analysis model for personal development competitive attitude with standardized coefficients. Note: The solid line refers to the statistically significant path. The dashed line refers to the statistically insignificant path. ** p < 0.01, *** p < 0.001. 95% CI are detailed between brackets.

