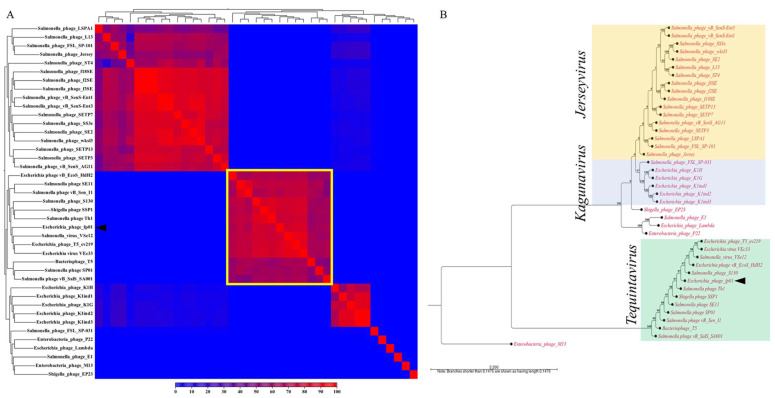
Figure 2.
Comparative genomic and evolutionary relationships of Escherichia phage FP01. (A) Heat map analysis visualization based on aligned Caudoviricetes bacteriophages’ whole genomes. The color bar below represents the percentage of identity within strains. (B) Phylogenetic tree of evolutionary history computed using the Neighbor-Joining method with a bootstrap test of 1000 replicates. The evolutionary distances were computed using the Jukes-Cantor method. Forty-one complete genomes were used for the genome alignment where Enterobacteria phage M13 was set up as outgroup. Ambiguous positions were removed for each sequence pair (pairwise deletion option). Analyses were conducted using CLCBio (v20.0).

