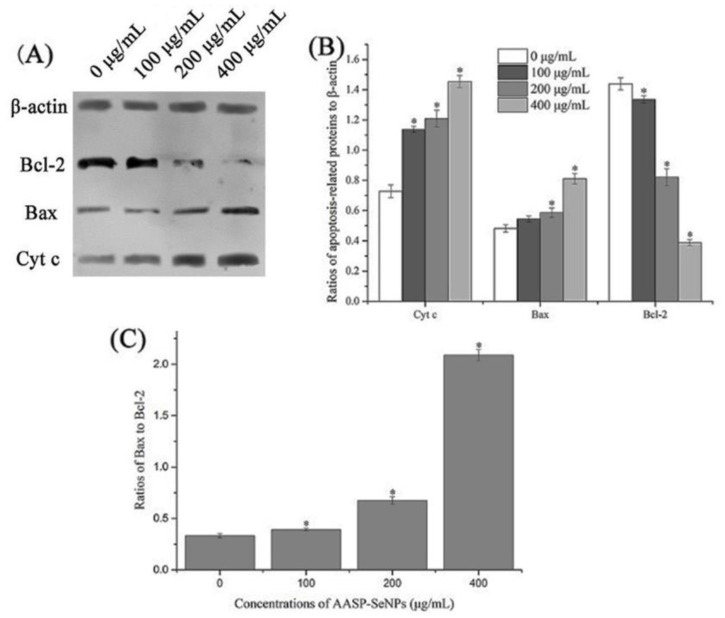
Figure 7.
Apoptotic protein levels of AASP-SeNP-processed HepG2 cells. Western blot results of Cyt c, Bax, and Bcl-2 protein levels (A). Quantitative analysis for the levels of Cyt c, Bax, and Bcl-2 proteins relative to β-actin (B). Effect of AASP−SeNPs on Bax/Bcl-2 ratios (C). Note: *, p < 0.05 compared with normal HepG2 cells.

