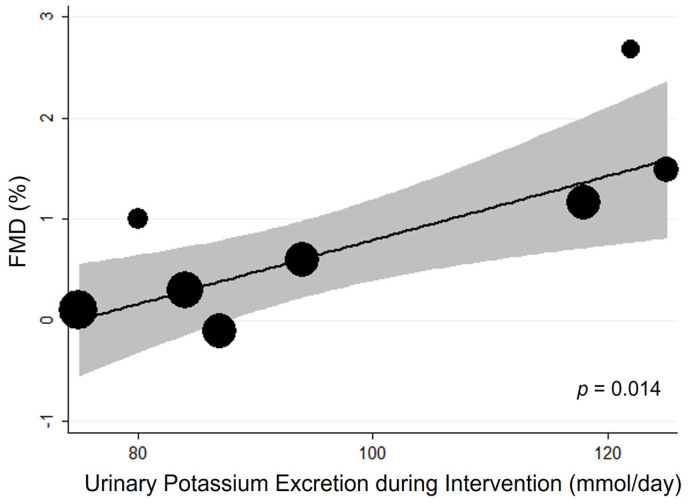
Figure 2.
Bubble plot for random-effects meta-regression of mean difference (MD) in flow-mediated dilation (FMD) by potassium supplementation of the single studies. Bubbles each represent one study and are plotted according to the study’s MD and urinary potassium excretion of the single study; bubble sizes reflect the relative weight apportioned to studies in the random-effects meta-regression; the solid line indicates the line of best fit. Potassium supplementation is represented by urinary potassium excretion (mmol/day).

