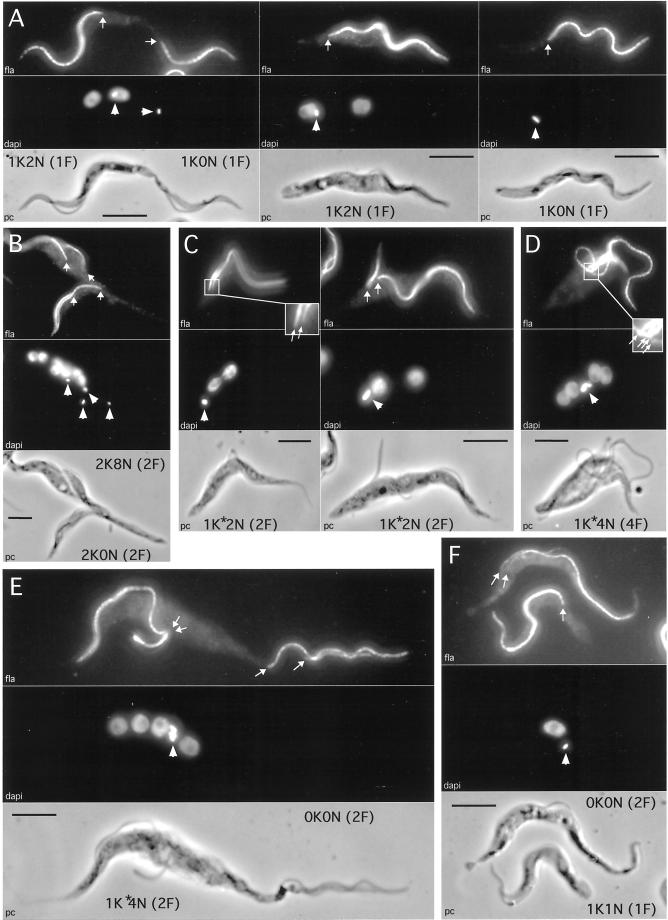
Figure 9.
Immunofluorescence analysis of procyclic cells overexpressing CAP17. Cells were tested with a flagellum-specific monoclonal antibody (top picture of each panel). Positions of the proximal base of the flagella (arrows) and kinetoplasts (arrowheads) were determined by DAPI staining (middle picture of each panel). Respective phase contrast (PC) images are also shown at the bottom of each panel. The nuclear (N), kinetoplast (K), and flagellum (F) contents are indicated beside each cell. Bar, 5 μm. Panel A represents individual 1K2N (central panel) and 1K0N (right panel) cells that are the result of mispositioning of the nucleus during cell division (left panel). Panel B shows a dividing aberrant cell leading to polynucleate (8N) and anucleate (0N) cells containing two flagella and two kinetoplasts. The next two panels (C and D) illustrate dividing cells with duplicated flagellum, nucleus, and kinetoplast, which fail to segregate the kinetoplasts. The two latter panels (E and F) show cells without kinetoplast or nucleus (0K0N) during (E) and after (F) aberrant cell division.

