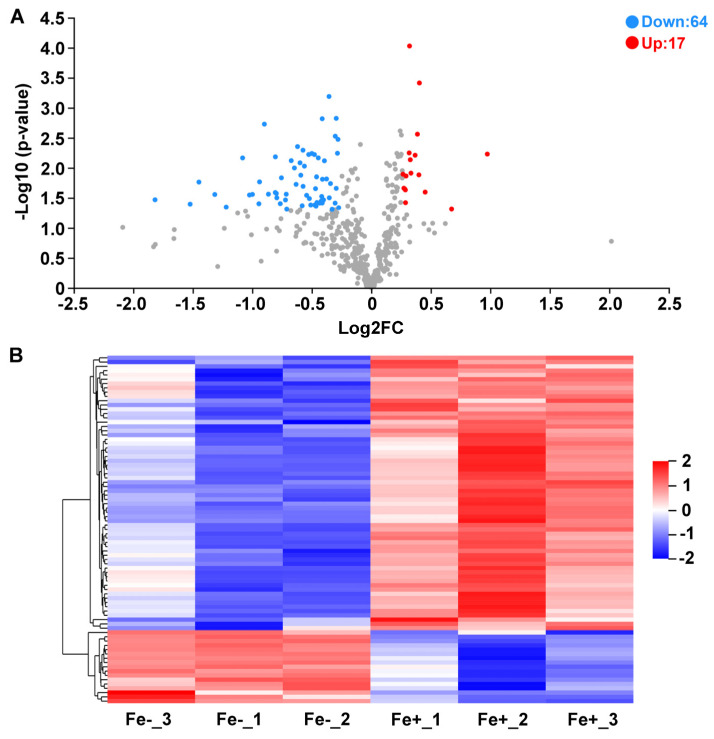
Figure 4.
Differentially expressed proteins (DAPs) between Fe-sufficient (Fe+) and Fe-deficient (Fe−) groups. (A) Volcano plot of DAPs. Red dot represents up-regulated proteins and blue dot represents down-regulated proteins. (B) Hierarchically-clustered heatmap diagram of DAPs. Each row represents one significant protein. Fe-_1, Fe-_2, Fe-_3: three biological replicates of Fe− group; Fe+_1, Fe+_2, Fe+_3: three biological replicates of Fe+ group.

