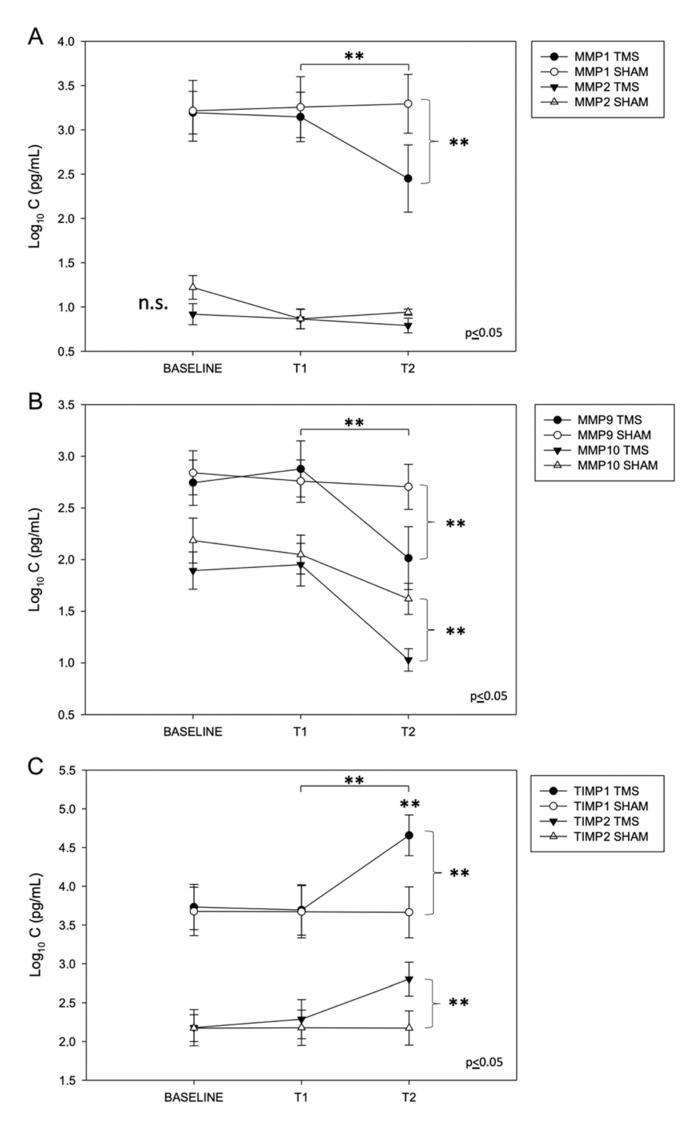
Figure 2.
Plasmatic levels of MMPs at baseline and after rTMS. (A,B) Significant reduction of MMP1, -9, and -10 plasmatic levels 6 months later after rTMS (T2, 24 weeks), compared to the SHAM group and to the levels at baseline and T1 (4 weeks after rTMS). No significant changes were detected for MMP2. (C) Significant increase of TIMP1 and TIMP2 plasmatic levels 6 months later after rTMS (T2, 24 weeks), compared to the SHAM group and to the levels at baseline and T1 (4 weeks after rTMS) (data expressed as mean ± standard deviation, ** = p ≤ 0.05).

