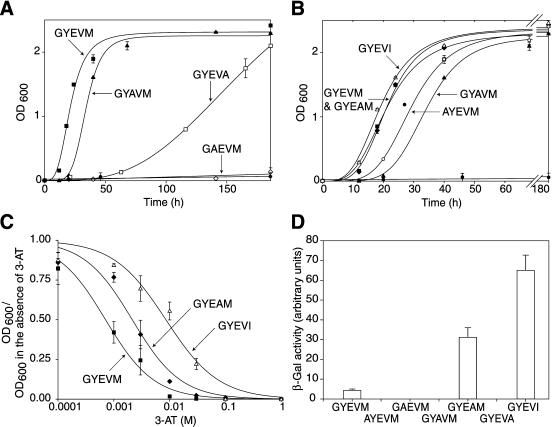
Figure 5.
Characterization of the interaction of the cytosolic domains of CD63 and mutated CD63 with μ3A in the yeast two-hybrid system. Yeast cells were transformed as described in Figure 4. (A and B) Cultures were set up containing 0.05 OD600 units of transfected cells into 2 ml of selective medium lacking histidine and grown at 30°C with shaking. OD600 measurements were made up to 180 h (B shows an expanded time scale). The control interaction between the C-terminal cytosolic domain of wild-type CD63 and empty VP16 (filled circles) is shown in each figure. Vector controls for other tails also showed no significant growth. Each point represents the mean ± SEM of the activity of three separate cultures. (C) Cultures of transformed yeast were established in selective medium lacking histidine, but containing 0–1 M 3-AT, and grown at 30°C with shaking. After incubation for 48 h, OD600 was measured and the ratio in the presence versus absence of 3-AT recorded. Each point represents the mean ± SEM of the activity of three separate cultures. (D) Cultures of transformed yeast were grown in medium containing histidine to an OD600 of ∼1.2. The β-galactosidase activity of the cultures was then measured. Each bar in the histogram represents the mean ± SEM of the activity of five separate cultures.

