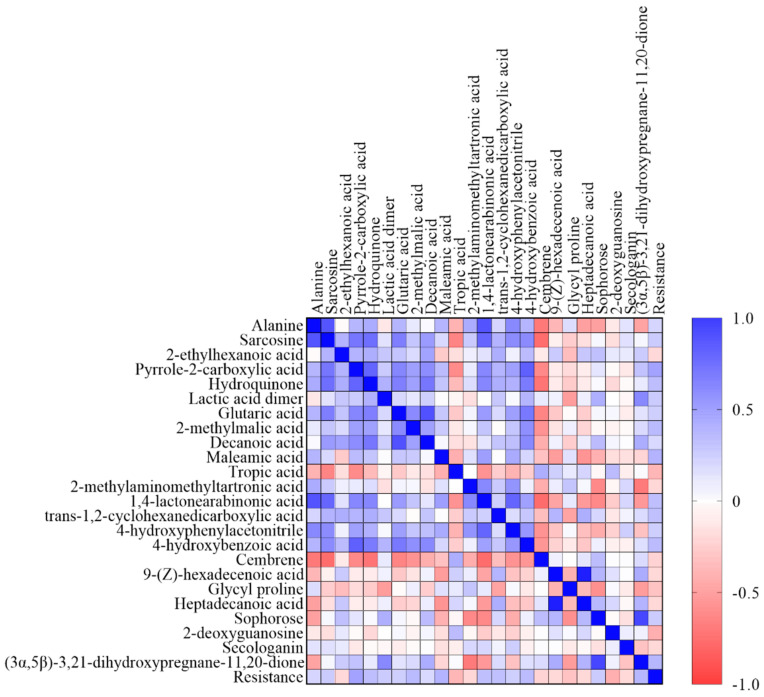
Figure 4.
Graphical Spearman correlation matrix of 24 wheat metabolites in grains and varietal resistance to Fusarium. Spearman correlation r values were determined using GraphPad Prism 9.4.1. Colors are added for better visualization. The colors span from dark blue to dark red, where dark blue denotes an r value of 1 and dark red indicates an r value of −1.

