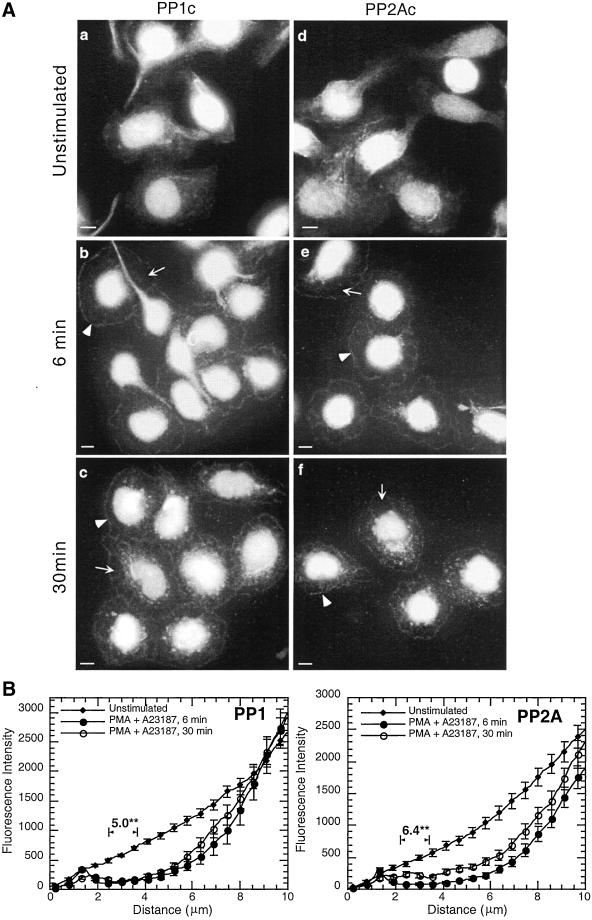
Figure 4.
Relocation of PP1 and PP2A to the periphery of the spreading cell after PMA plus A23187 stimulation. Adherent monolayers of RBL-2H3 cells were incubated in buffer alone for 6 min (a and d) or with 50 nM PMA plus 500 nM A23187 for 6 min (b and e) or 30 min (c and f), fixed, and proteins detected as detailed in MATERIALS AND METHODS. PP1c (a–c) and PP2Ac (d–f) were detected using specific polyclonal antibodies and FITC-labeled secondary antibodies. Arrowheads highlight the band of protein around the peripheral edges of the cells and arrows highlight regions where protein has cleared from the cytoplasm. The images focus on the basal surface of the cells and are representative of those seen in at least three separate experiments. Bar, 5 μm. A fluorescence intensity graph of compiled line measurements from the edge of the cell to the beginning of the nucleus, as described in the legend to Figure 3, is depicted (B). The data (mean ± SE) from unstimulated cells and those stimulated with PMA plus A23187 for 6 and 30 min are plotted together for comparison. Numerical data above the graphs indicate the difference in the clearance (fold decrease) between unstimulated and 6 min PMA plus A23187-stimulated cells. The significance of this difference is indicated (**p < 0.002).

