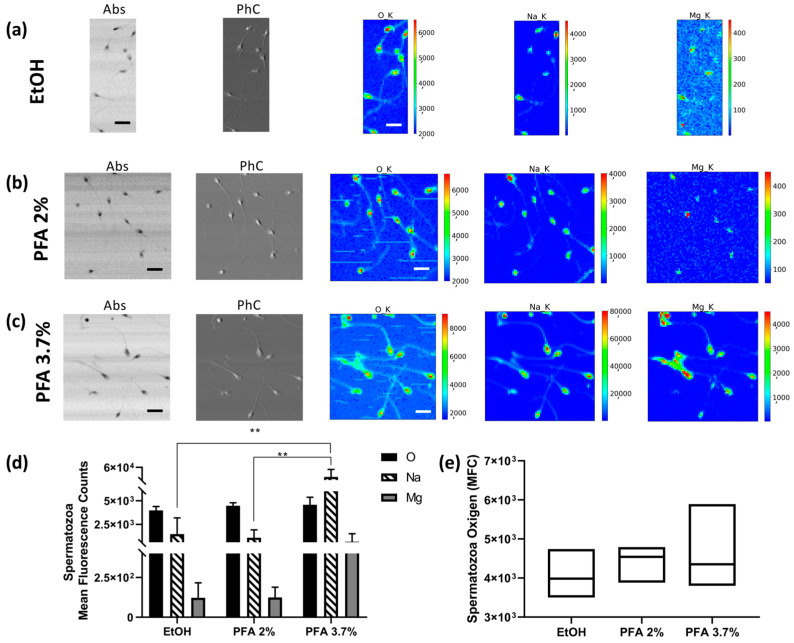
Figure 4.
STXM and XRF analysis of human spermatozoa. Absorption (Abs) and phase contrast (PhC) images, together with O, Na and Mg maps of spermatozoa fixed with different methods: (a) EtOH 70% (mapped area 30 × 75 µm2), (b) PFA 2% (mapped area 70 × 70 µm2), and (c) PFA 3.7% (mapped area 70 × 70 µm2). Scale bars are 10 µm. (d) Normalised average XRF counts of O, Na, and Mg in spermatozoa fixed with EtOH 70%, PFA 2%, and 3.7% evaluated on at least 6–10 cells/patient/fixation method. (e) Min-to-max box plot comparing oxygen MFC as obtained by descriptive statistical analysis used to determine the coefficient of variation. A two-way ANOVA with multiple comparisons test was performed to test the statistical difference among the fixation methods. ** p < 0.005. The STXM images (Abs and PhC) and XRF images were acquired at 1500 eV excitation energy with a step size of 400 nm and 1 μm, respectively, and an acquisition time of 5 ms/pixel and 10 s/pixel, respectively.

