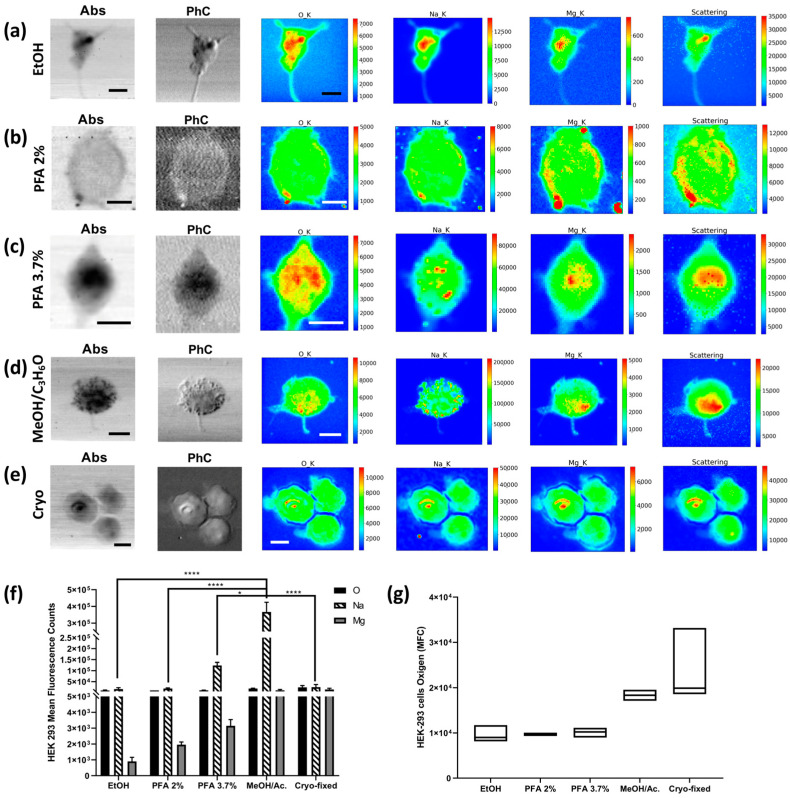
Figure 6.
STXM and XRF analysis of HEK-293 cells. Absorption (Abs) and phase contrast (PhC) images, together with O, Na, Mg, and Scattering maps of HEK-293 cells fixed with different methods: (a) EtOH 70% (mapped area 45 × 45 µm2), (b) PFA 2% (mapped area 34 × 34 µm2), (c) PFA 3.7% (mapped area 25 × 30 µm2), (d) 1:1 MeOH/C3H6O (mapped area 40 × 40 µm2), and (e) cryofixed (mapped area 50 × 50 µm2). Scale bars are 10 µm. (f) Normalised average X-ray fluorescence counts of O, Na, and Mg in HEK-293. A two-way ANOVA with multiple comparisons test was performed on at least on 4 cells/fixation method to test the statistical difference among the fixation methods. * p < 0.05, **** p < 0.0005. (g) Min-to-max box plot comparing oxygen MFC as obtained by descriptive statistical analysis used to determine the coefficient of variation. The STXM images (Abs and PhC) and XRF images were acquired at 1500 eV excitation energy with a step size of 500 nm and an acquisition time of 33 ms/pixel and 6 s/pixel, respectively.

