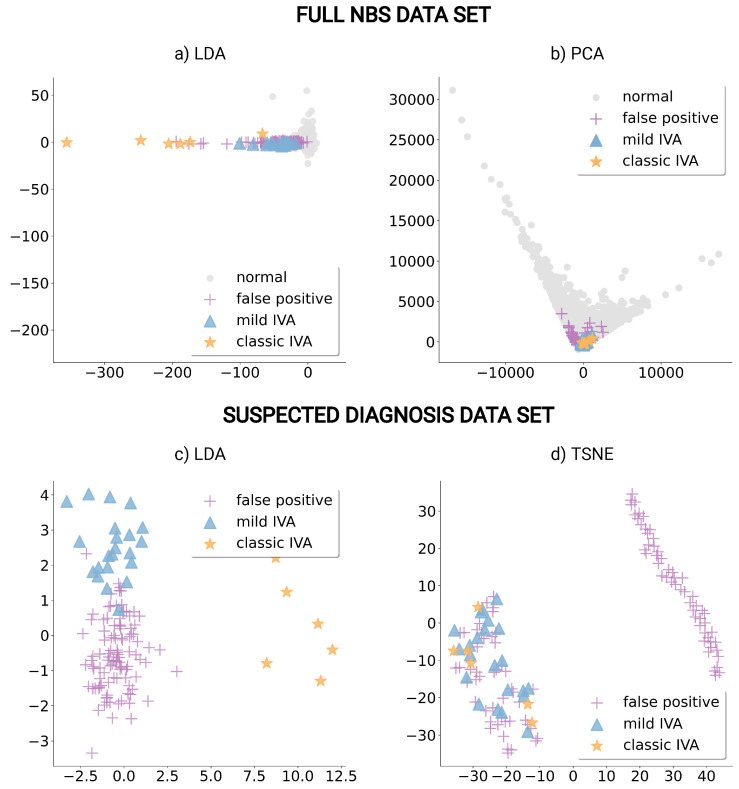
Figure 3.
Dimensionality reduction plots of NBS profiles presenting normal in gray (circle) and false positive newborns in purple (cross) as well as newborns with mild IVA in blue (triangle) and with classic IVA in orange (star). Dimensions from linear discriminant analysis (LDA) are presented for the full NBS data set (a) and the suspected diagnosis data set (c). The first two principal components from principal component analysis (PCA) from the full data set (b) and the first two dimensions of T-distributed stochastic neighbor embedding (TSNE) created from the suspected diagnosis data set (d) are presented.

