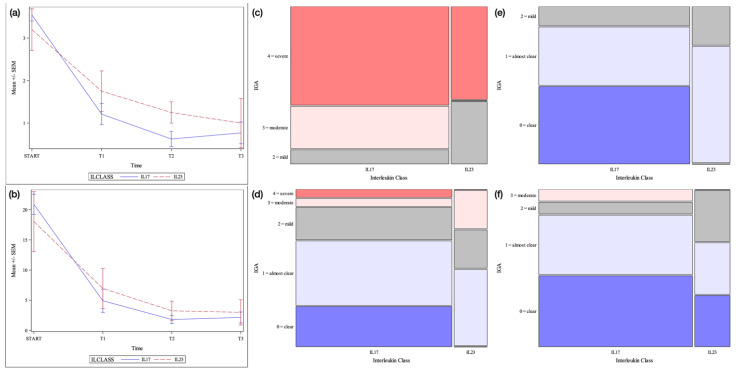
Figure 2.
Erythrodermic psoriasis cohort. Legend: (a) = Mean +/− SEM IGA score by time point and interleukin class. SEM = Standard error of the mean (b) = Mean +/− SEM PASI score by time point and interleukin class (c) = Mosaic plot of IGA scores by interleukin class: baseline (d) = Mosaic plot of IGA scores by interleukin class: week 12 (e) = Mosaic plot of IGA scores by interleukin class: week 24 (f) = Mosaic plot of IGA scores by interleukin class: week 48.

