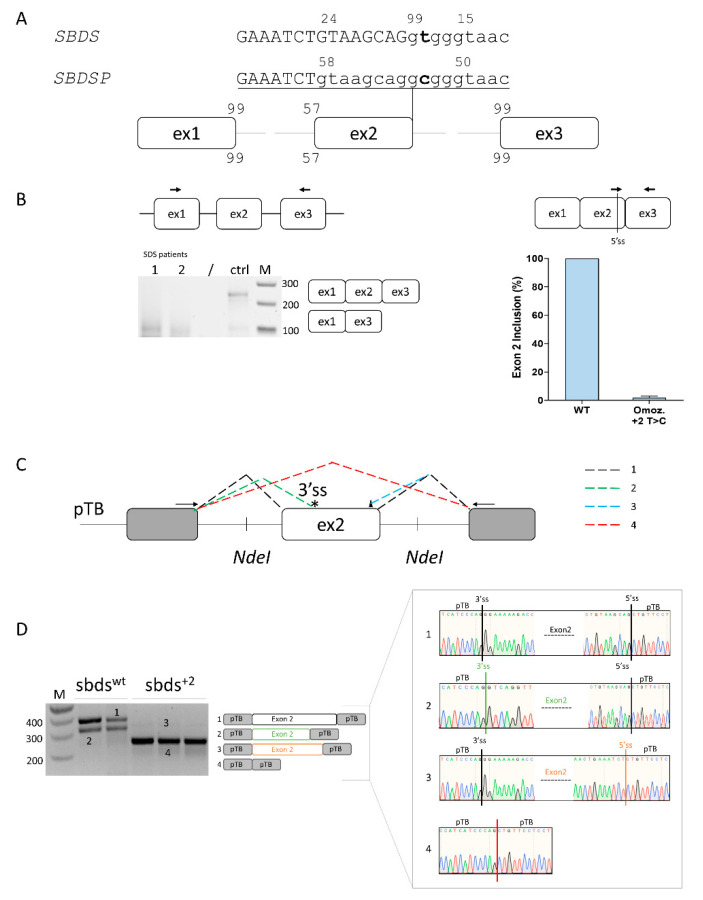
Figure 1.
Ex vivo and in vitro evaluation of SBDS exon 2 inclusion. (A) Schematic representation of the SBDS and SBDSP pre-mRNAs focused on exon 2, with exons and introns indicated by boxes and lines, respectively. The numbers indicate the score of 3′ss and 5′ss in both SBDS and SBDSP contexts. Intron and exon sequences are in lower and upper case, respectively; (B) Evaluation of SBDS transcripts (left) and quantification of SBDS exon 2 inclusion (right) in immortalized lymphoblastoid cells derived from SDS patients homozygous for the c.258+2T>C mutation or normal subject as a control. The schematic representation of the SBDS mRNA context, with primers exploited to evaluate splicing patterns and quantify correctly spliced mRNA, is indicated above. Amplified products were separated on 2.5% agarose gel. M, 100 bp molecular weight marker; (C) Schematic representation of the minigene, containing the human SBDS exon 2 genomic sequence. The fragment was cloned as in the pTB vector by exploiting the NdeI sites. Exonic and intronic sequences are represented by boxes and lines, respectively. The colored dotted lines recapitulate the alternative usage of the splice sites, which originate the different transcript isoforms (1 to 4) detected by in vitro splicing analysis and reported in panel D. Primers (arrows) used to perform the RT-PCR are indicated on top. The 3′ and 5′crypric sites are indicated with an asterisk and a triangle, respectively; and (D) Evaluation of SBDS splicing patterns in HEK293T cells transiently transfected with wild-type (sbdswt) or mutated (sbds+2) minigenes. The schematic representation of the transcripts (with exons not in scale) is reported in the middle. Numbers represent correctly spliced transcripts (1), those arising from the usage of the cryptic 3′ss (2), of exonic 5′ss (−8 bp) (3), or from exon 2 skipping (4), respectively. Amplified products were separated on 2.5% agarose gel. M, 100 bp molecular weight marker. Sanger sequencing of transcripts is reported on the right.

