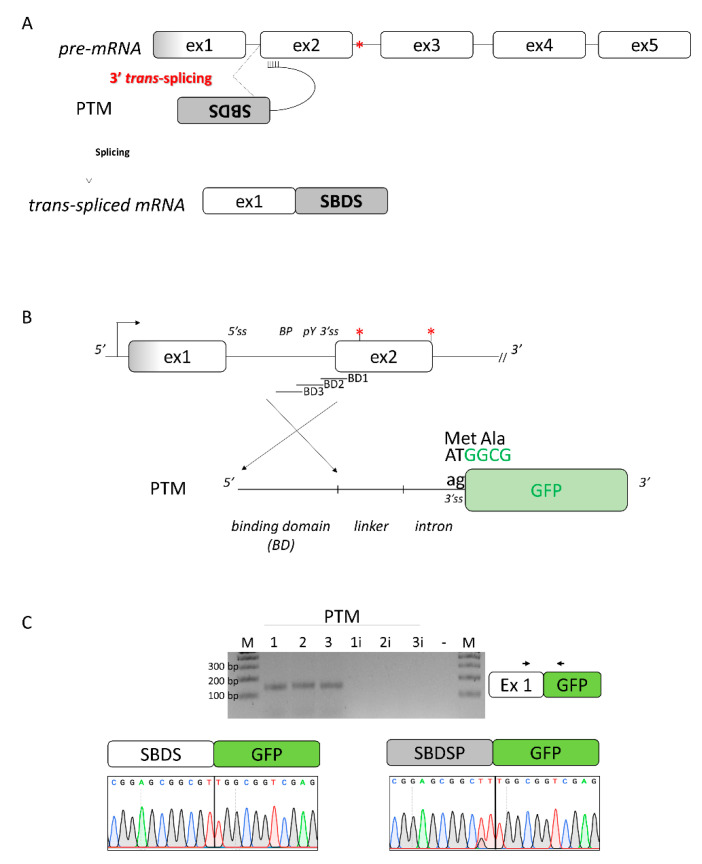
Figure 3.
Design of the 3′ pre-trans-splicing molecule (PTM) for SBDS exon 2 and trans-splicing studies. (A) Schematic of the trans-splicing process. The complete SBDS and SBDSP transcript region from exon 2 to 5, with the c.258+2T>C mutation indicated by the red asterisk, is replaced by its wild-type copy provided by the PTM. Exons and introns are not in scale; (B) Schematic representation of the PTMs designed to induce SBDS trans-splicing. The c.258+2T>C and c.183-184TA>CT mutations are indicated by red asterisks. The sequence of the green fluorescence protein (GFP), without the initial AT dinucleotide of the first triplet and exploited to evaluate the occurrence of the trans-splicing process, is reported in green. BD: binding domain of the PTM molecules; and (C) Evaluation of trans-splicing in HEK293T cells co-transfected with PTM or PTMi, exploited as controls. The position of primers is indicated by arrows, and the expected transcript is indicated on the right. Amplified products were separated on 2.5% agarose gel. M, 100 bp molecular weight marker. Sanger sequencing of transcripts is reported on the bottom.

