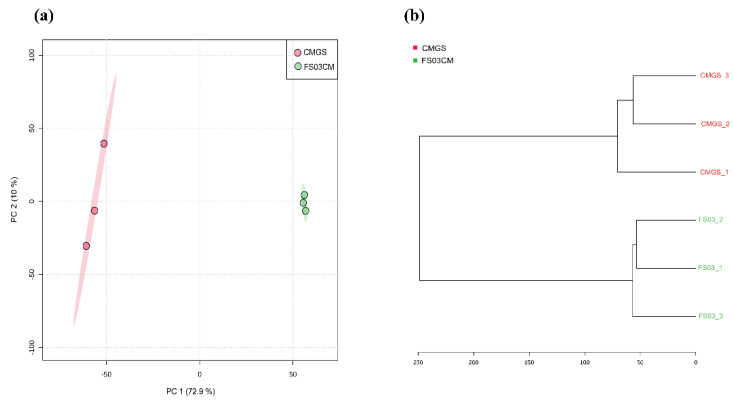
Figure 1.
Two-dimensional PCA score plot and hierarchical cluster analysis dendrogram of metabolomics data obtained for FS03CM and CMGS. PCA score plot shows the differences in metabolome profiles of FS03CM and CMGS (a). Dendrogram shows the relationship between FS03CM and CMGS medium based on their metabolomic profiles (b). Dendrogram was constructed using ward clustering on the closest Euclidean distances between samples. Samples are color coded as indicated in the figure legend. Numbers represent sample IDs.

