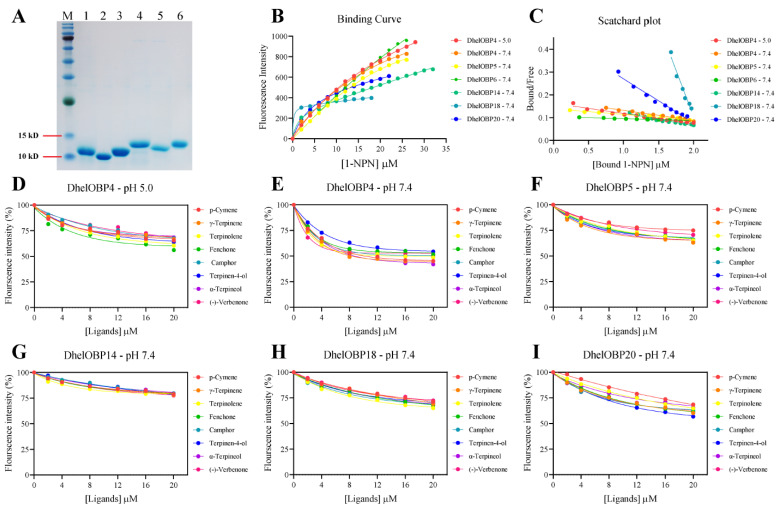
Figure 6.
(A) SDS-PAGE analysis of target DhelOBPs. M, molecular marker; 1, DhelOBP4; 2, DhelOBP5; 3, DhelOBP6; 4, DhelOBP14; 5, DhelOBP18; 6, DhelOBP20. (B) Binding curve for 1-NPN to target DhelOBPs. (C) Scatchard plot of target DhelOBPs. (D) Binding curve for HIPVs to DhelOBP4 at pH 5.0. (E–I) Binding curve for HIPVs to DhelOBP4, DhelOBP5, DhelOBP14, DhelOBP18 and DhelOBP20 at pH 7.4, respectively.

