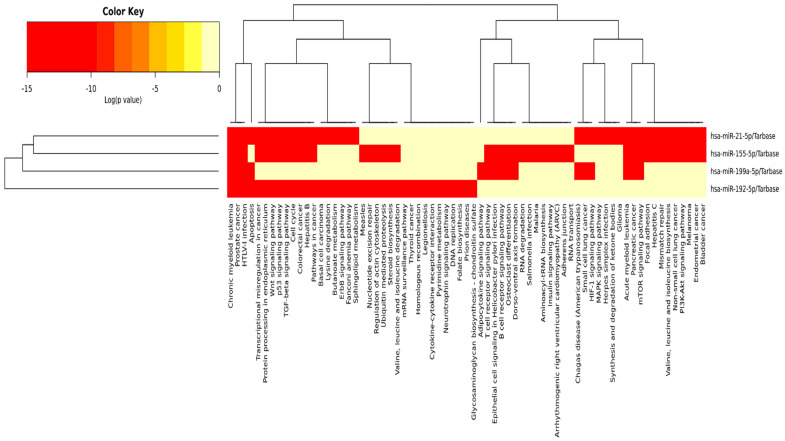
Figure 3.
Heatmap showing KEGG pathway intersection/union with all the investigated hsa-miRs; miR cluster dendrogram on the left side of the figure, and KEGG pathways cluster dendrogram in the figure’s upper part. Targeted KEGG pathways, with statistically significant results for all the investigated miRs in red by Tarbase (a posteriori analysis method after an enrichment analysis was performed) (https://dianalab.e-ce.uth.gr/html/universe/index.php?r=mirpath#mirnas=hsa-miR-21-5p;hsa-miR-155-5p;hsa-miR-192-5p;hsa-miR-199a-5p&methods=Tarbase;Tarbase;Tarbase;Tarbase&selection=2). p value threshold set at 0.05 and MicroT threshold set at 0.8. Accessed on 18 November 2022.

