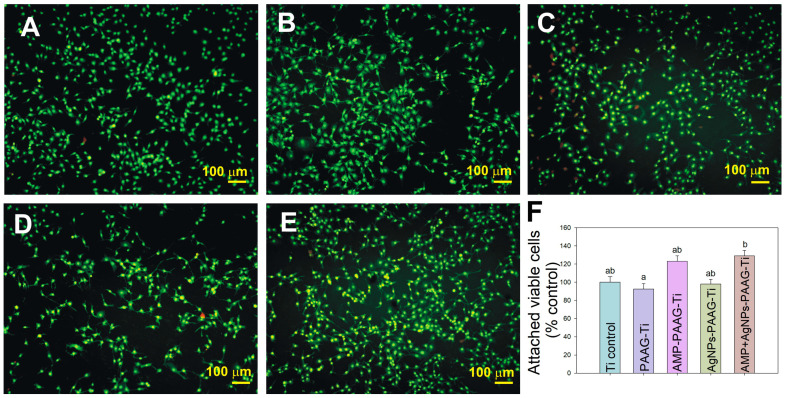
Figure 9.
Epifluorescence images of pre-osteoblast cells (MC3T3-E1) cultured on the modified Ti surfaces: (A) Ti control (bare Ti); (B) PAAG–Ti; (C) AMP–PAAG–Ti; (D) AgNPs–PAAG–Ti; (E) AgNPs+AMP–PAAG–Ti. (F) Quantification of viable attached pre-osteoblast cells (MC3T3E-1) growing on modified Ti surfaces expressed as a percentage of Ti control. Data are expressed as mean ± standard error of the mean (SEM). Statistical differences were analyzed using multiple comparisons of Bonferroni with 99.9% of confidence. There are no statistically significant differences between data sharing identical letters in the graph.

