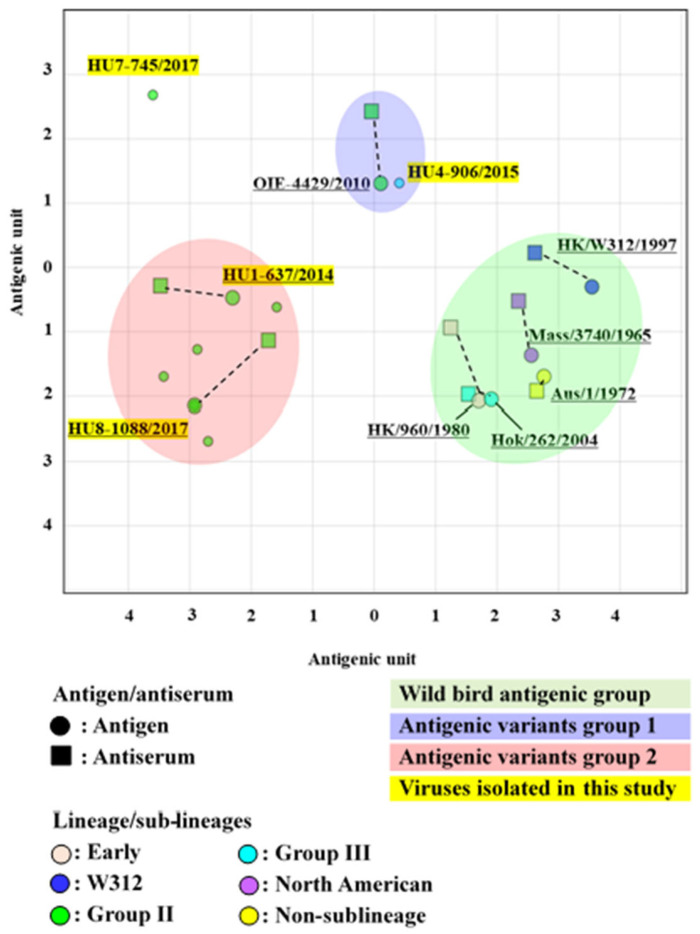
Figure 5.
An antigenic map of H6 viruses based on the cross-HI tests on viruses and sera of different lineages. In the antigenic map, both the vertical and horizontal axes represent the antigenic distance. The spacing between the grid lines represents a 1 antigenic-unit distance, corresponding to a 2-fold dilution in the HI assay (2 units correspond to a 4-fold dilution, 3 units correspond to an 8-fold dilution, etc.). Different antigenic groups are indicated by different colors (green, blue, and red). Dotted lines indicate a combination of the homologous viruses and antisera.

