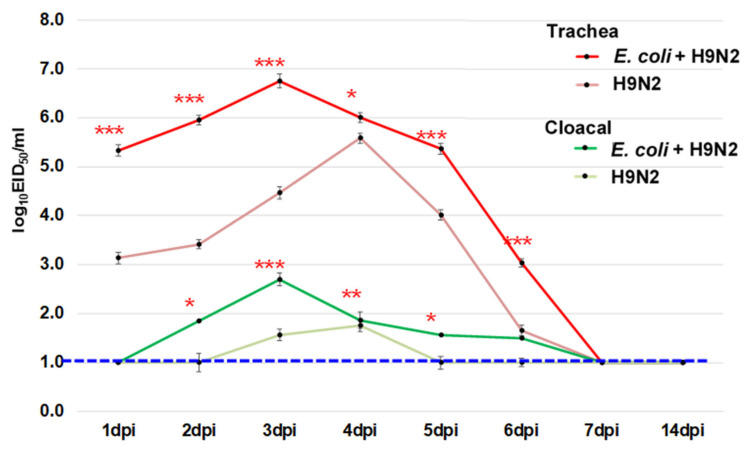
Figure 7.
The virus recovery from the trachea and cloacal swabs in chickens. Chickens were inoculated intranasally with 109.0 CFU of E. coli O2 two days prior to challenge of 10 6.0 EID50 of a representative H9 LPAIV (A/chicken/Vietnam/HU8-1860/2017 (H9N2) in the red circle in Figure 1). The swabs were taken from 1 to 14 dpi. Bars indicate the standard error of mean. Statistical significance was calculated using Tukey’s test. Significant differences in viral titers between groups are indicated by * (p < 0.05), ** (p < 0.01), and *** (p < 0.001). The dotted line indicates the detection limit of the test.

